Simultaneous Confidence Intervals
Since we know there is a significant difference between drug and placebo in treating at least one of the 3 symptoms, we would like to identify which symptoms are different.
Example 1: For the data from Example 2 of Hotelling’s T2 for Independent Samples, determine for which symptoms the drug is significantly different from the placebo.
As we did in the one-sample and paired sample cases we now seek to find confidence intervals for each of the symptoms. Once again we consider both the simultaneous 95% confidence intervals and the Bonferroni 95% confidence intervals.
To determine the simultaneous 95% confidence intervals, we note (as in the one-sample case) that the 1 – α confidence hyper-ellipse for the population mean difference vector μ = μX – μY is given by
where T2 is as in Definition 1 of Hotelling’s T2 for Independent Samples. Thus we are looking for values of μX – μY which fall within the hyper-ellipse given by the equation
From the 1 – α confidence hyper-ellipse, we can also calculate simultaneous confidence intervals for any linear combination of the means of the individual random variables. For example, for the linear combination
(where μi = μX,i – μY,i), the simultaneous 1 – α confidence interval is given by the expression
where the pooled covariance matrix S = [sij].
For the case where c = μi the simultaneous 1 – α confidence interval is given by the expression
Example
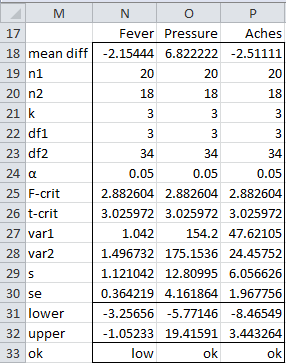
The simultaneous confidence intervals for Example 1 are as shown in Figure 1.
Figure 1 – Simultaneous 95% confidence intervals
Since 0 is in the confidence interval for Pressure and Aches, we conclude there is no significant difference between the drug and placebo for these symptoms.
Since the endpoints of the confidence interval for Fever are both negative, we conclude that patients taking the drug have significantly less fever than those who take the placebo.
Bonferroni Confidence Intervals
As in the one-sample case, if we are only interested in looking at single variables and not linear combinations, we will be better off using Bonferroni confidence intervals since these intervals will tend to be narrower. We now turn our attention to this analysis and use the following formulas for the 1 – α confidence intervals:
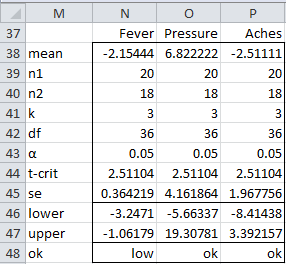
 where the tcrit is based on a significance level of α/k. The relevant calculations are given in Figure 2.
Figure 2 – Bonferroni 95% confidence intervals
The confidence intervals in Figure 2 are narrower than those in Figure 1, but the results are similar.
Effect size
The Mahalanobis Distance can be used as a measure of effect size, where
Assumptions
Hypothesis testing using the T2 statistic for two independent random vectors X and Y is based on the following assumptions:
- Each of the random vectors has a common population mean vector
- X and Y have a common population covariance matrix Σ
- X and Y are multivariate normally distributed
- Each of the samples is done randomly and independently
Normality
That X and Y are normally distributed implies that each variable in X and Y is normal (or at least roughly symmetric). This can be tested as described in Testing for Normality and Symmetry (box plots, QQ plots, histograms, etc.). You can also produce a scatter diagram for each pair of variables in X and each pair of variables in Y. If the random vectors are multivariate normally distributed then each plot should look roughly like an ellipse. These are not sufficient to show that X and Y are multivariate normally distributed, but it may be the best you will be able to do. Fortunately, Hotelling’s T-square test is relatively robust to violations of normality.
Also, if nX and nY are sufficiently large then the Multivariate Central Limit Theorem holds and so we can assume that the normality assumption is met.
Common covariance matrix
In the univariate case for two-sample hypothesis testing of the means, the t-test can be used provided the variances of the two samples are not too different, especially if the sample sizes are equal.
Similarly in the multivariate case, Hotelling’s T-square test can be used provided nX = nY and the sample covariance matrices don’t look too terribly different.
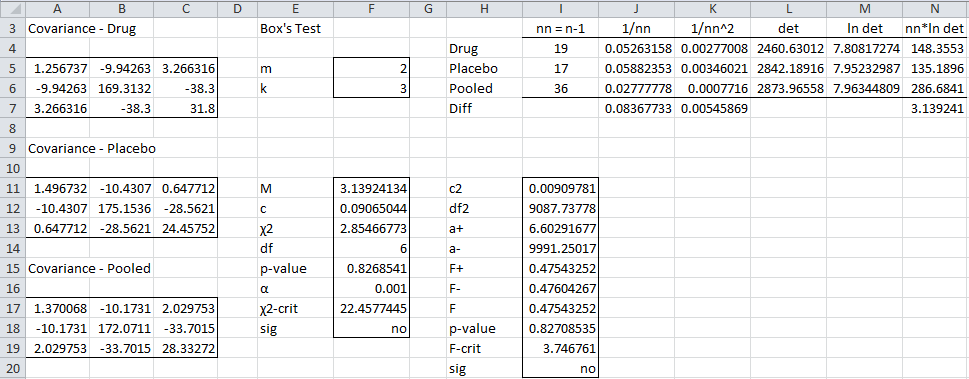
We can use Box’s Test to check the null hypothesis that the two sample covariance matrices are equal. The caution here is that this test is very sensitive to violations of normality (even though Hotelling’s T-square test is not very sensitive to such violations). For Example 1 of Hotelling’s T2 for Independent Samples, Box’s test yields the results shown in Figure 3.
Figure 3 – Box’s test
Since p-value > α = .001, we cannot reject the null hypothesis that the covariance matrices are equal. See Box’s Test for more details about Box’s Test.
Examples Workbook
Click here to download the Excel workbook with the examples described on this webpage.
References
Penn State University (2013) Hotelling’s T-square. STAT 505: Applied multivariate statistical analysis (course notes)
https://online.stat.psu.edu/stat505/lesson/7/7.1/7.1.3
Rencher, A.C. (2002) Methods of multivariate analysis (2nd Ed). Wiley-Interscience, New York.
http://math.bme.hu/~csicsman/oktatas/statprog/gyak/SAS/eng/Statistics%20eBook%20-%20Methods%20of%20Multivariate%20Analysis%20-%202nd%20Ed%20Wiley%202002%20-%20(By%20Laxxuss).pdf
Johnson, R. A. and Wichern, D. W. (2007) Applied multivariate statistical analysis. 6th Ed. Pearson.
https://mathematics.foi.hr/Applied%20Multivariate%20Statistical%20Analysis%20by%20Johnson%20and%20Wichern.pdf


Am I correct that both the Hotelling t-square test and Box’s test require more observations than variables?
Hello David,
I looked into Hotelling’s T-square test. Indeed the number of rows can’t be less than the number of dependent variables. They can be equal though except in the case where there is one dependent variable (equivalent to a t-test).
Charles
David,
For the two independent samples test with n1 and n2 rows in the two samples, the requirement is n1+n2 > k where k = the number of dependent variables.
Charles
Hi Charles,
My question is related to simultaneous and Bonferroni CI’s. Can you explain why one would be interested in all linear combinations (simultaneous) and contrast that to why one would be interested in only single variables? I’m assuming its related to alpha-inflation.
Thank you,
Hi Brad,
See https://www.real-statistics.com/multivariate-statistics/hotellings-t-square-statistic/one-sample-hotellings-t-square/
Charles
In Box’s test the p-value is 0.01.
Now i accept or reject the null hypothesis?
If you are using alpha = .01, then the result is at the boundary. Probably I would assume that I could proceed with the Hotelling’s T-square analysis.
Charles
Hello ,
Im going to use T-square Independent for my final year project .
Can i know what is the suitable scale for my questionnaire for this t-square independent method analysis
Hello Tiara,
If you are referring to a Likert scale, the more intervals the better: 1-7 is better than 1-5 and 1-5 is better than 1-3.
Charles
Hello. Awesome web.
In Figure 1, how do you calculate “s” and “se”? I’m trying in Excel and I don’t reach the same values. I’m writing something wrong.
Marco,
For Fever s_1 (cell N29) is calculated by =SQRT(((N19-1)*N27+(N20-1)*N28)/(N19+N20-2))
se_1 (cell N30) is calculated by =N29*SQRT(1/N19+1/N20)
Charles
Dear Charles,
I’m a phd Student and I have some problems with my data. To sump up, I have one factor with two groups and 2 variables for each one. After remove the incomplete cases and non numeric data, the first group has 72 cases and the second 57. The Box test has a significant outcome, so I reject the null hypothesis of equal covariances matrix. Anyway I tried a MANOVA analysis an T2-Hotelling test. In both of test, I have a significant outcome, but since the simultaneous and Bonferroni intervals are different, with MANOVA the factor accounts for the difference in means vector observed whereas in T2-Hotelling test the two dependent variables are ok. Why?
How should I interpret the results? Because I focus in Hotelling outcome, I meet significant differences but not due to these variables and focusing on MANOVA the same variables play a role in the significant difference?
Thanks in advance and congratulations for the really useful website.
Almudena,
I am pleased that you have found the website useful.
Sorry, but without seeing your data and analysis, I am unable to comment on the issues that you have raised.
Charles
Charles,
May I send you a mail with my excel file (data and analysis)?
Thanks
Yes. My email address can be found on the webpage Contact Us
Charles