This webpage describes the various worksheet functions and data analysis tools provided by the Real Statistics Resource Pack that support the creation and utilization of univariate Gaussian Mixture Models (GMM) in Excel. Examples are also provided.
Worksheet functions
The Real Statistics Resource Pack provides the following worksheet functions to support GMM for data consisting of numeric values (univariate case) based on the sample in the n × 1 array R1.
UniGMM(R1, k, lab, iter, prec, R0, kiter, nruns): outputs a GMM model which for each cluster 1, 2, …, k, estimates the univariate normal distribution for that cluster (consisting of the mean and standard deviation) as well as the probability that a data vector best fits that particular cluster.
If lab = TRUE a column of labels is appended to the output (default FALSE). iter = the maximum number of iterations of the EM algorithm (default 20). This algorithm also terminates if the difference in LL value from the previous iteration is less than prec. If prec = 0 (default), then iter iterations are made.
This function returns a 4 × k array (or one more column if lab = TRUE). The first three rows contain the weight, mean, and standard deviation for each cluster. The last row consists of the LL value and the # of iterations (if no convergence after iter iterations, then iter+1 is returned).
Cluster Initialization
The GMM model is initialized with the cluster values in the n × 1 column array R0 which only contains values 1, 2, …, k. If R0 is omitted then the cluster values from a K-means++ cluster algorithm on R1 with kiter iterations (default 10) and nruns runs (default 5) are used.
Instead of initializing the model by specifying its initial clusters, the model can be initialized by specifying the means of the clusters using 1/k as the initial weights and the standard deviation of the sample as the initial values of each of the σj. Three approaches are supported:
- The means of each cluster are specified explicitly in R0 when R0 is a 1 × k numeric row array.
- When R0 contains the value “r”, the means are assigned randomly to values between the minimum and maximum values in the sample.
- When R0 contains any numeric value, the means are assigned as described in Example 1 of GMM Example.
Cluster Assignments
UniGMMClust(R1, R2, sorted): outputs an n+1 × k+2 array whose first column contains the data in R1, and whose next k columns show the probability that each data element in R1 belongs to each one of the k clusters based on the GMM model described in R2. Finally, the last column of the output shows the cluster with the highest probability for each data vector in R1. If sorted = TRUE then the output is sorted by the cluster number in the last column; otherwise (default) the order is the same as in R1.
The last row of the output consists of the fraction of entries in R1 assigned to each cluster plus the total number of rows in R1.
Examples
Example 1: Create a GMM model with 3 components based on the data in range A2:B13 of Figure 1.
Figure 1 – Univariate GMM clustering
Using the array formula =UniGMM(A2:A13,3,TRUE), we obtain the model described in range C2:F5. Since the R0 argument is omitted, the clusters are initialized using k-means clustering. The weights for the 3 clusters are shown in the first row (.332188, .416667, .251145), the means for the 3 clusters in the second row, and the standard deviation in the first row. LL for this model is -19.6709, and the full 20 default iterations are used to obtain this model. It is not clear whether additional iterations would produce a better model (e.g. one with a larger LL).
Using the array formula =UniGMM(A2:A13,3,TRUE,40,.0001,0), we obtain the model described in range C9:F12. Since the R0 argument is assigned the value 0, the means are initialized using approach #3 above. The maximum number of iterations is specified as iter = 40, but we see that convergence was reached after 25 iterations since the change in LL was less than the prec = .0001 at that point.
Using the array formula =UniGMMClust(A2:A13,C9:F12), we obtain the cluster allocations for the 12 sample elements shown in range H2:L13. This output is described following Figure 5 of GMM Example. We obtain the same output but in sorted order by cluster assignment in range N2:R13.
Plot
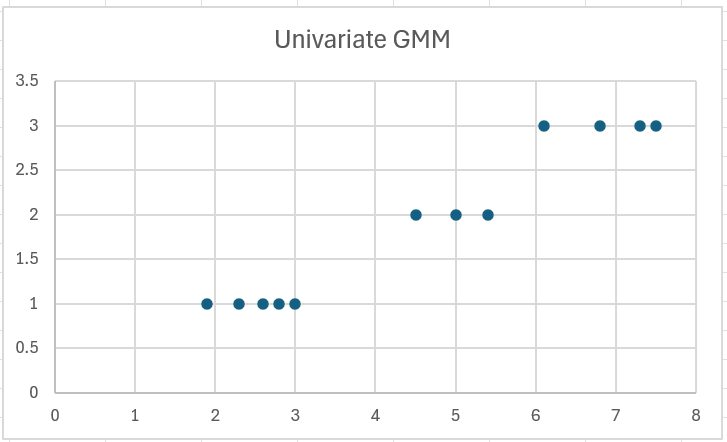
We can use a chart to visualize univariate cluster allocations more clearly. To do this for Example 1, highlight range R2:R13 and N2:N13, and then select Insert > Charts|Scatter. After adding a heading, the result is shown in Figure 2.
Figure 2 – Univariate GMM chart
Data Analysis Tool
The Real Statistics Resource Pack also provides a GMM Cluster Analysis data analysis tool which uses the above two worksheet functions to perform GMM cluster analysis for univariate or multivariate data. See Real Statistics Multivariate GMM Support for details.
Examples Workbook
Click here to download the Excel workbook with the examples described on this webpage.
References
McGonagle, J. et al (2024) Gaussian mixture model
https://brilliant.org/wiki/gaussian-mixture-model/
Carrasco, O. C. and Whitfield, B. (2024) Gaussian mixture models explained
https://builtin.com/articles/gaussian-mixture-model
GeeksforGeeks (2023) Gaussian mixture model
https://www.geeksforgeeks.org/gaussian-mixture-model/
Apgar, V. (2023) 3 use-cases for Gaussian Mixture Models (GMM)
https://towardsdatascience.com/3-use-cases-for-gaussian-mixture-model-gmm-72951fcf8363

