Data Analysis Tool
Real Statistics Data Analysis Tool: The Real Statistics Resource Pack contains the Factor Analysis data analysis tool, which automates most of the Factor Analysis capabilities described on this website.
To access this data analysis tool, first press Ctrl-m and then select the Factor Analysis option from the Multivar tab (or from the Multivariate Analyses option of the main menu if using the original user interface). The dialog box in Figure 1 will then appear.
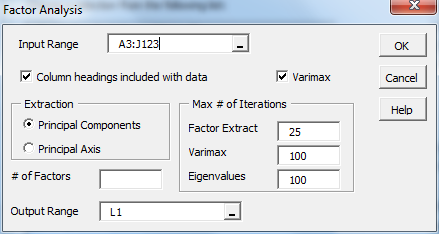
Figure 1 – Factor Analysis dialog box
If you click on the Help button the following dialog box will appear.
Figure 2 – Help for Factor Analysis data analysis tool
As seen in Figure 1, you are presented with a choice between using Principal Component extraction or Principal Axis extraction. You can choose to use Varimax rotation or not. You can also choose to specify the number of factors to use in the model (# of Factors); if this field is left blank then the Kaiser criterion is used, namely that all factors whose eigenvalue is 1 or greater are retained.
Principal Component Extraction
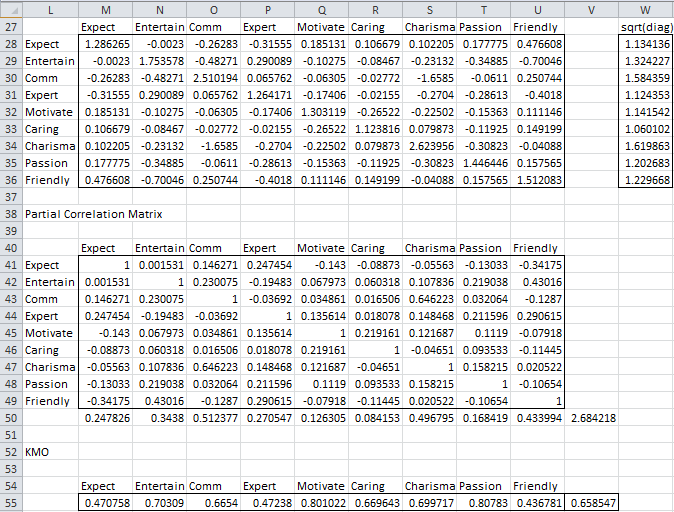
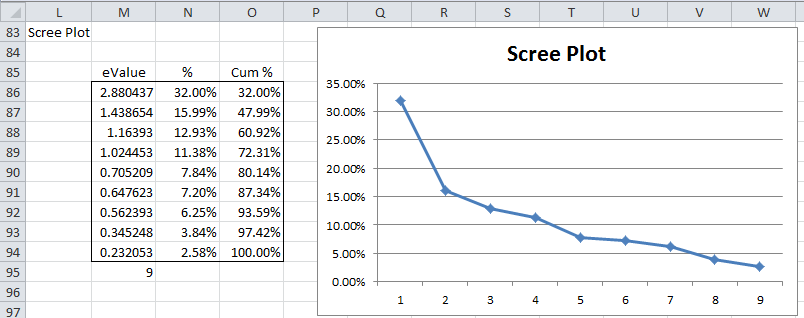
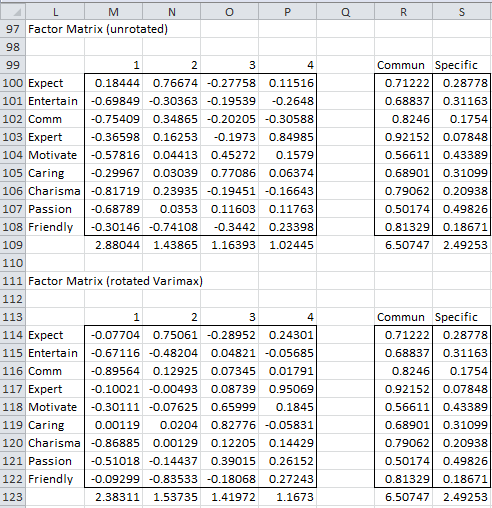
If you choose the Principal Component extraction option then the following output will appear (all the data refers to Example 1 of Factor Extraction):
Figure 3 – Factor Analysis PCA Extraction – part 1
Figure 4 – Factor Analysis PCA Extraction – part 2
Figure 5 – Factor Analysis PCA Extraction – part 3
Figure 6 – Factor Analysis PCA Extraction – part 4
Figure 7 – Factor Analysis PCA Extraction – part 5
In order to display the rotated factor matrix shown in range B114:E122, the VARIMAX array function is used. This function is provided in the Real Statistics Resource Pack.
VARIMAX(R1, iter, prec) = the result of rotating the square matrix defined by range R1 using the Varimax algorithm, where iter is the maximum number of iterations (default 100) and prec is the value that is considered to be sufficiently close to zero (default 0.00001).
In Figure 7, range B114:E122 contains the formula =VARIMAX(M100:P108).
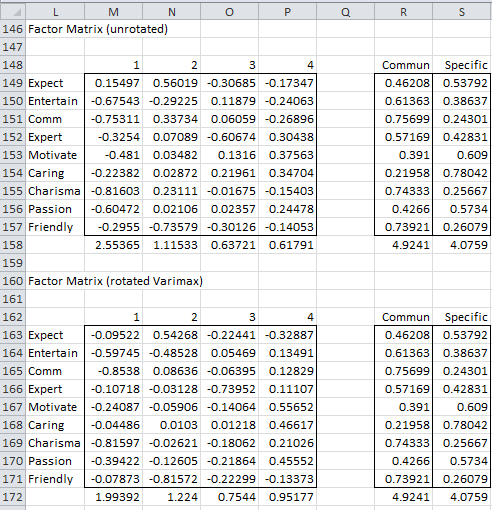
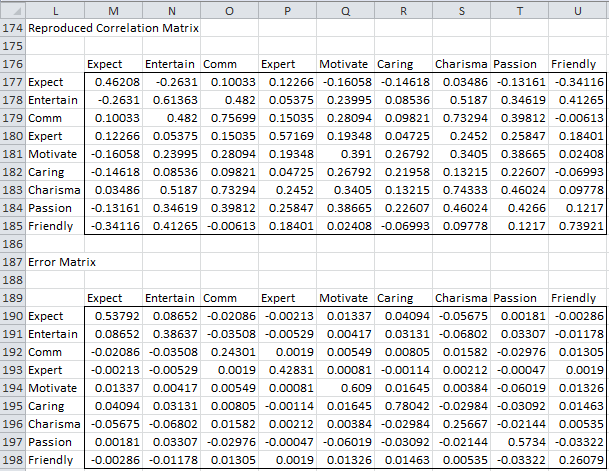
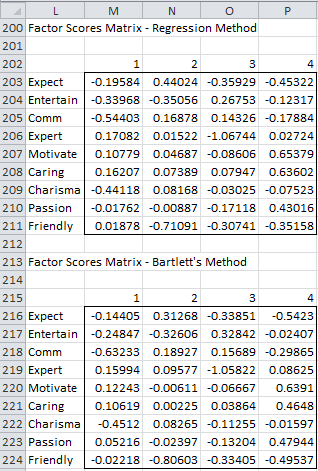
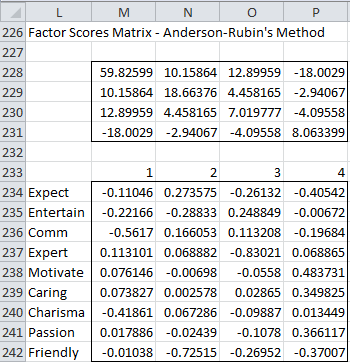
Figure 8 – Factor Analysis PCA Extraction – part 6
Figure 9 – Factor Analysis PCA Extraction – part 7
Figure 10 – Factor Analysis PCA Extraction – part 8
Principal Axis Extraction
If you choose the Principal Axis extraction method then the output is similar to that described above. In fact, the output starts out identically as described in Figures 3 and 4 (except that the title is Factor Analysis – Principal Axis Extraction).
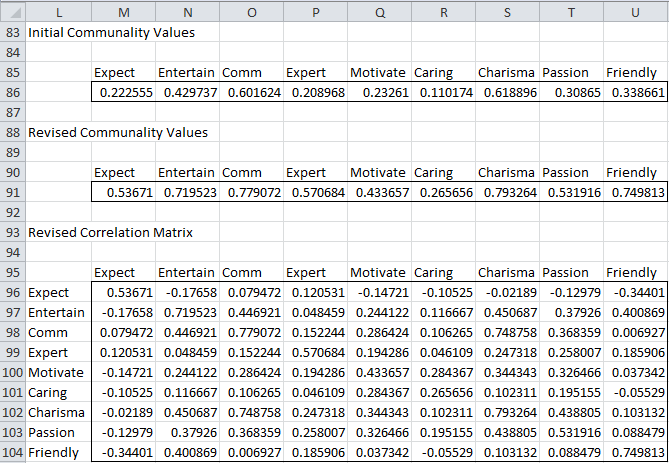
As described in Principal Axis Extraction, the Real Statistics software next calculates the initial communalities and revised communalities (using the ExtractCommunalities worksheet function) as described in Figure 11.
Figure 11 – Factor Analysis PAF Extraction – part 3
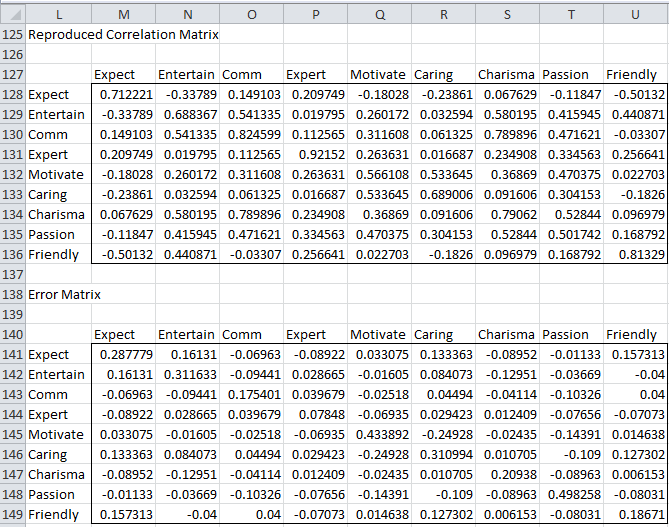
From this point on the data analysis tool calculates its results exactly as in Principal Component extraction except that the revised correlation matrix (range M96:104 in Figure 11) is used as the correlation matrix.
Figure 12 – Factor Analysis PAF Extraction – part 4
Figure 13 – Factor Analysis PAF Extraction – part 5
Figure 14 – Factor Analysis PAF Extraction – part 6
Figure 15 – Factor Analysis PAF Extraction – part 7
Figure 16 – Factor Analysis PAF Extraction – part 8
Figure 17 – Factor Analysis PAF Extraction – part 9
Examples Workbook
Click here to download the Excel workbook with the examples described on this webpage.
References
Johnson, R. A., Wichern, D. W. (2007) Applied multivariate statistical analysis. 6th Ed. Pearson
https://mathematics.foi.hr/Applied%20Multivariate%20Statistical%20Analysis%20by%20Johnson%20and%20Wichern.pdf
Rencher, A.C., Christensen, W. F. (2012) Methods of multivariate analysis (3nd Ed). Wiley





May I ask how do you group the variable if there are 4 components, I try by using SPSS, but it shows 4 variables in group 1, 2 variables in group 2 , 2 variables in group 3 and only 1 variables in group 4
I don’t completely understand your question, but perhaps the following webpage can be helpul
https://real-statistics.com/multivariate-statistics/factor-analysis/determining-number-of-factors/
Charles
Charles,
Thanks for dedicating so much of your time to developing this tool!
I just downloaded the Add-In (I’ve tried both XRealStats and XRealStatsX) and I’m getting strange results. I’m attempting to learn factor analysis by walking through this example. I’ve followed the directions here and my output looks almost the same, but when I get to the table of eigenvectors, many (but not all) of the the signs are reversed. Am I doing something wrong, or is this perhaps a bug?
Thanks,
Dan
Hi Dan,
As long as the signs are consistently reversed there is no problem. The signs of all eigenvectors don’t need to be reversed. But for any one eigenvector, the signs of all the entries need to be reversed or none of them.
Recall that if X is an eigenvector, then so is -X.
Charles
Thanks.
I have installed your add-in, and it looks promising. One problem: I am on Win 10, version 2004, Excel 2019. Once I activate your add-in, I see Add-Ins in the toolbar at the top of my screen, along with Home, Data, etc. I click on Add-Ins and yours appears, but after running a single routine, it disappears. It stays gone until I deselect your add-in, save the file and re-select the add-in. If I close the file, after reactivating the add-in, I no longer see Add-Ins in the toolbar and have to repeat the process again.
Any suggestions would be helpful.
Jim,
See Disappearing Add-in Ribbon
Charles
hi,
is it possible to construct eigenvectors\eigenvalues based on reproduced correlation matrix?
Sure. Why do you want to do this?
Charles
Hi, I’m making APC on my data set, I’ve got 11 different variables hence I obtain 11 principal component, is there any way that I obtain less components?
Hello Paulina,
See https://real-statistics.com/multivariate-statistics/factor-analysis/determining-number-of-factors/
Charles
Hi Charles,
I am another user that very much appreciates your efforts in making these univariate and multivariate GLM statistical tools readily available. I am quite familiar with principle components analysis for exploratory pattern analysis of complex geochemistry and contaminant data (e.g. for lake sediments).
Using the Real Stats factor analysis functions, I was able to quite easily figure out how to generate unrotated and varimax rotated factor loadings for a set of 15 mineralogical/chemical variables for 200+ sediment samples.
is there a relatively simple method to also calculate principal component scores for each of the 200+ samples on the reduced number of factors defined through the scree plot?
Doug,
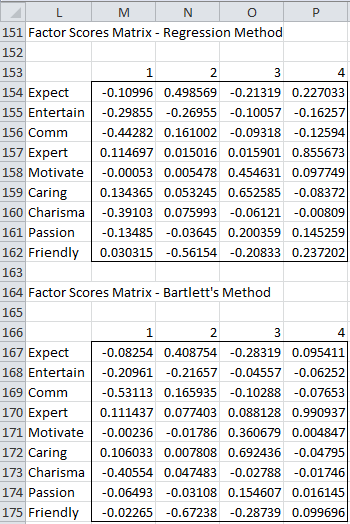
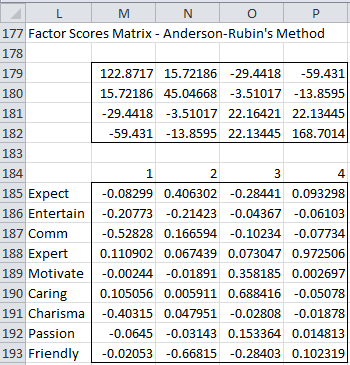
Perhaps you are referring to the factor scores. This topic is described on the following webpage:
https://real-statistics.com/multivariate-statistics/factor-analysis/factor-scores/
I think that the Real Statistics Factor Analysis data analysis tool includes these.
Charles
I’ve selected input range and outputs as I’ve seen in this example, with headers for my rows and columns, but the analysis results in a runtime error, aborting the analysis tool and declares a type mismatch.
I have 19 samples which each have relative abundance %s of 24 genomic families. Not seeing how my commands were different from the example.
Thank you very much for this helpful tool.
Phil,
If you send me an Excel file with your data and analysis, I will try to figure out what has gone wrong. You can find my email address at
Contact Us
Charles
Hi,
It’s great tool thank you.
What are the limitations of the it?
How many rows it can calculate ?
Thank you
Sarah,
I can’t recall the exact limitation in the number of rows, but for many of the data analysis tools it isabout 65,000.
Charles
Thank you
Hello,
Thank you for providing this resource pack. I have very little experience in statistical analysis. I would like to perform a factor analysis on my data set. I am unsure what the input range is. Could you tell me how I determine what the input range is for my data? Thank you.
Tiffany
Tiffany,
The input should consist of the values of each of the k variables for all n subjects.
For the Real Statistics data analysis tool the input should take the format shown in Figure 1 of the following webpage
https://real-statistics.com/multivariate-statistics/factor-analysis/principal-component-analysis/
Charles
Thank you 🙂
Another question is:
I have demographic questions, how can I know what is the demographic distribution of each group.
Thanks again
Tur
Hi Charles,
It’s a great tool, Thank you.
I did not understand how to find the size/weight/importance of each group.
i.e. in the teachers example what is the percentage of each one of the 4 groups.
Thanks!
Tur
Tur,
This is explained on the other webpages describing Factor Analysis. Please go to the following webpage:
Factor Analysis
Charles
Hi Charles,
The factor analysis function is wonderful – but I’m having a problem. For the very last chart, the varimax rotation chart (the main one I need) is showing #VALUE! in every cell of the chart. In the initial selection box for the function, I had changed the max # of eigenvalues from the default of 100 to 1. This did give me the scree plot, which I wasn’t given when I left the max eigenvalues at 100.
I’ve probably messed things up by changing it to 1 – but any thoughts on how to fix the #VALUE! problem in the varimax chart while maintaining my scree plot?
Stats aren’t my strong suit so a lot of this is way over my head.
Thanks!
BWhite
Hi,
If you send me the spreadsheet with your data and the results you obtained, I will take a look at it and try to figure out where the problem is.
Charles