Basic Concepts
When the equal covariance matrix assumption is not satisfied, we can’t use linear discriminant analysis (see Linear Discriminant Analysis) but should use quadratic discriminant analysis instead.
Quadratic discriminant analysis is performed exactly as in linear discriminant analysis except that we use the following functions based on the covariance matrices for each category:
![]()
![]()
Examples
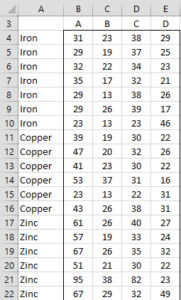
Example 1: We want to classify five types of metals based on four properties (A, B, C, and D) based on the training data shown in Figure 1. We also want to see how good this classification is for the mean vectors for each of the metals in the training data.
 |
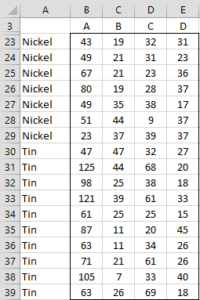 |
Figure 1 – Training data
Covariance matrices
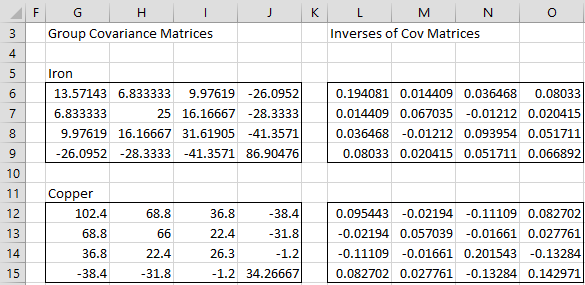
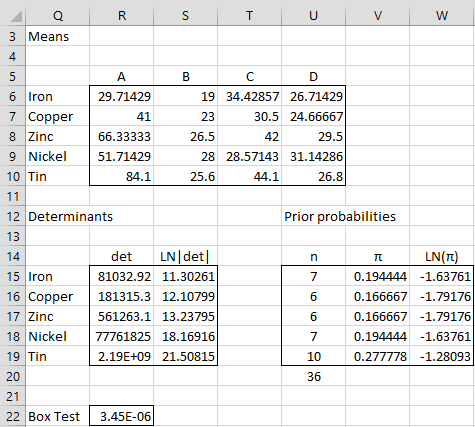
As we see in Figure 3 (cell R22), the p-value for Box’s test is 3.4E-06, which indicates heterogeneity of covariance matrices, and so we will use quadratic discriminant analysis. We, therefore, need to calculate the individual covariance matrices as shown in Figure 2 (only two of the five covariance matrices and their inverses are shown in the figure).
Figure 2 – Covariance matrices
E.g. the covariance matrix for Iron shown in range G6:J9 is calculated using the array formula =ExtractCov($A$4:$E$39,G5), as described in Real Statistics Support for MANOVA.
Figure 3 – Discriminant Analysis continued
We calculate the mean vectors for each category (range R6:U10 of Figure 3) as we did for Example 1 of Linear Discriminant Analysis. This time we need the determinant of each of the covariance matrices as well as the log of this value. E.g. cell R15 contains the formula =MDETERM(G6:J9) and cell S15 contains the formula =LN(ABS(R15)).
This time we set the prior probabilities to the proportion of each category in the training set. E.g. cell U15 contains the formula =COUNTIF($A$4:$A$39,Q15), cell V15 contains the formula =U15/U$20 and cell W15 contains the formula =LN(V15).
Classification Tables
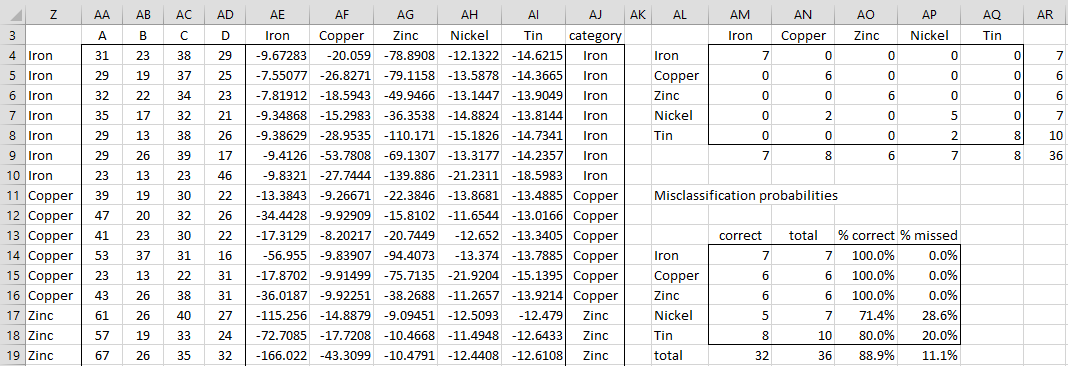
We create the classification tables as we did for Example 1 of Classification Table (see Figure 4, where only the first 16 of 36 vectors are shown). E.g. the value in cell AE4 contains the following array formula:
=$W$15-$S$15/2-MMULT(AA4:AD4-$R$6:$U$6,MMULT($L$6:$O$9, TRANSPOSE(AA4:AD4-$R$6:$U$6)))/2
Figure 4 – Classification Tables
We see that the classifications for Iron, Copper, and Zinc are 100% correct, while Nickel and Tin are 71.4% and 80.0% correct respectively.
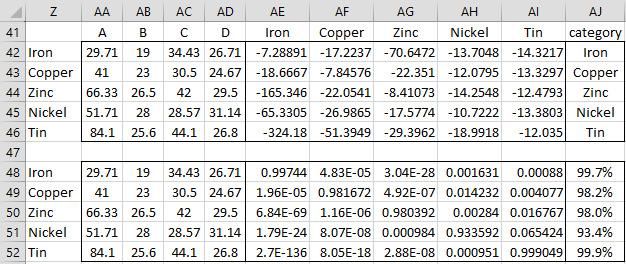
Finally, we calculate the classifications for the sample mean vectors (shown in range R6:U10 of Figure 3). Each of these is categorized correctly as shown in range AJ42:AJ46 of Figure 5.
Figure 5 – Categorization and posterior probabilities
The posterior probabilities for the same vectors are shown in range AE48:AI52, with the maximum value shown in range AJ48:AJ52. In fact, as we can see that the posterior probabilities for the mean vectors of Iron and Tin are close to 100% (0.3% and 0.1% error respectively). Copper, Zinc, and Tin are at least 98% accurate (i.e. at most 2% error), with Nickel at 6.6% error.
Examples Workbook
Click here to download the Excel workbook with the examples described on this webpage.
Reference
Penn State (2017) Quadratic discriminant analysis. STAT 505 Applied Multivariate Statistical Analysis
https://online.stat.psu.edu/stat505/lesson/10/10.6
Is there a way to use the training data to determine how some questionable items would be classified? I am using quadratic discriminant analysis on data for three plant species. The training data consists of measurements of 8 characters on 20 specimens of each of three species. It suggests that the characters can be used to identify the species (QDA placed all but one in the right species). I also have data from another four specimens that did not seem to fit well into anyone of the three species. I would like to know how they would be placed by the QDA analysis, assuming that the training data are representative. This may be, in effect, the same question as the one about the discriminant functions, functions that would allow one to determine how a non-training record would be classified.
Mary,
The training data is used to build a model, and this model, in turn, is used to classify new data. This process is explained for LDA, but the approach is similar for QDA. For LDA, see
https://www.real-statistics.com/multivariate-statistics/discriminant-analysis/linear-discriminant-analysis/
Perhaps I don’t fully understand your question since I believe the approach for doing what you are requesting is described on the Real Statistics website.
Charles
Hi Charles,
Thanks very much for putting together such a comprehensive tutorial on what is a very complex topic for a non-specialist.
I am trying to apply this method to an empirical database to predict a stable/unstable outcome based on two input variables for a new case. I also wish to superimpose a discriminant line (or curve, depending on which is most appropriate) onto a scatter plot of the two variables. I believe I have setup the worksheet correctly as per your tutorial but I am uncertain of how to plot the discriminant line/curve. I would really appreciate your help with this.
Regards,
M
Matt,
What do you define the discriminant line/curve to be?
Charles
I assume it would be the line/curve corresponding to an equal likelihood of stable/unstable for variable X? I essentially wish to have a boundary where a point plotting on one side can be considered “likely” to be stable and, conversely, unstable on the other.
Matt,
I am still trying to grasp the concept of this equal likelihood line/curve that you are looking for. What does your intuition tell you about where this line/curve would be for the Metal variable in Example 1? Also, how do you deal with the case where there are more than two options as is the case for Example 1?
Charles
Is the any way to get the discriminant function coefficients from this worksheet like was done for linear discriminant analysis? Thanks.
Hello Will,
The approach for quadratic discriminant analysis is pretty similar to that for linear discriminant analysis. Can you point me to the coefficients for linear discriminant analysis that you want for quadratic discriminant analysis (preferably a range on one of the spreadsheets)?
Charles
Thanks for emailing me this clarification.
I don’t recall similar coefficients for QDA, and these are not necessary to make the classifications.
Charles