Basic Concepts
The Real Statistic data analysis tool and cluster analysis functions described in Real Statistics Support for Cluster Analysis are based on using Euclidean distance; i.e. the Minkowski distance where p = 2. Cluster analysis can also be performed using Minkowski distances for p ≠ 2. Also, weighted distances can be employed (see Weighted Minkowski Distance). For data that consist of n-tuples, a fixed column array of weights of size n is used.
The following are modified versions of the cluster analysis worksheet functions described in Real Statistics Support for K-means Cluster Analysis. Here, p defaults to 2 and Rw is an optional n × 1 column array of weights.
Revised Worksheet Function Definitions
CLUST(R1, k, R2, p, Rw, iter) = m × 1 column array of cluster numbers 1, 2, …, k calculated by the k-means algorithm for the data consisting of n-tuples in the m × n array R1 where R2 is an m × 1 column array containing the initial cluster number assignments. If R2 is omitted then the k-means++ algorithm is used to calculate the initial cluster number assignments. iter = the maximum number of iterations of the algorithm that are performed (default 200).
ClustAnal(R1, k, nreps, p, Rw, iter) = the m × 1 column array of cluster numbers produced by CLUST(R1, k R2, p, Rw, iter) with the lowest error after nreps repetitions of k-means++ algorithm). If nreps = 0 then the m × 1 column array of initial cluster numbers based on the k-means++ algorithm is returned.
CLUSTERS(R1, R2, p, Rw) = m × 1 column array of cluster numbers 1, 2, …, k corresponding to the centroids described in the n × k array R2 which are closest (based on the weighted Minkowski distance defined by p and Rw) to the respective data element in the m × n range R1.
More Functions
The Real Statistics Resource Pack also supports the following non-array functions.
CLUSTErr(R1, R2, k, p, Rw) = error statistic for the data in the m × n array R1 based on the cluster assignment in the m × 1 column array R2 based on k clusters 1, 2, …, k. If k = 0 or is omitted then k is set to the largest value in R2.
CENTROIDErr(R1, R2, p, Rw) = error statistic for the data in the m × n array R1 based on the centroids specified in the n × k array R2
CLUST_Converge(R1, R2, p, Rw) = TRUE if the m × 1 column array R2 of cluster numbers 1, 2, …, k calculated by the k-means algorithm for the m n-tuple data elements in the m × n range R1 has converged (i.e. one additional iteration of the algorithm does not result in any changes to the cluster assignments.
The error statistics in CLUSTERErr and CENTROIDErr are the sum of the pth powers of the Minkowski distances between each of the data elements and its closest centroid. When p = 2 this is the SSE statistic used in Real Statistics Support for K-means Cluster Analysis.
Example using Weights
Example 1: Repeat Example 1 of Real Statistics Support for K-means Cluster Analysis using the weights described in column I of Figure 1.
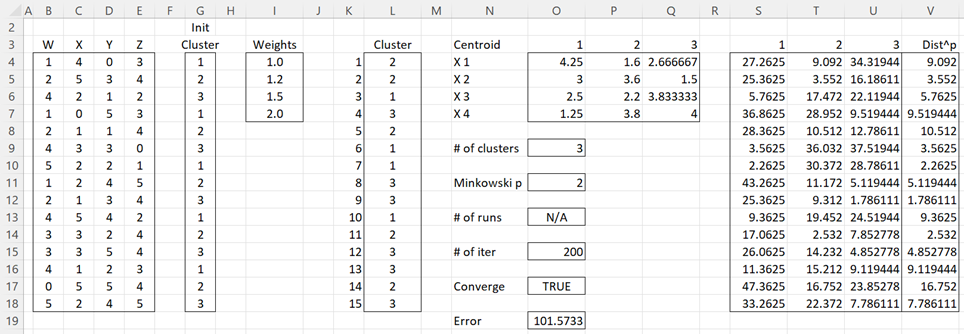
Figure 1 – Cluster analysis with weights
Figure 1 shows the results when the clusters are initialized as shown in column G. We can obtain these results using the K-means Cluster Analysis data analysis tool. Here we fill in the dialog box as shown in Figure 2 of Real Statistics Support for K-means Cluster Analysis. This time we insert I4:I7 in the Weights Range and K3 in the Output Range.
If we use k++ means to initialize the clusters, we insert H4:H7 in the Weights Range and J3 in the Output Range obtaining the results shown in Figure 2.
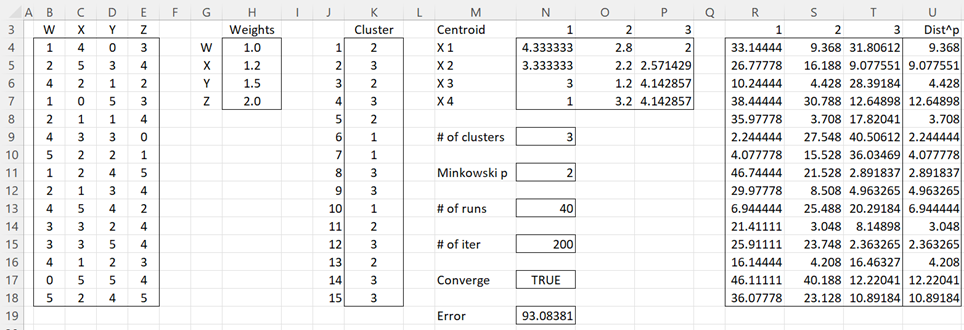
Figure 2 – k++ means cluster analysis with weights
Note that the error term has been reduced by using the k++ means algorithm to initialize the clusters.
Example using Minkowski Distance
Example 2: Repeat Example 1 using the k++ means algorithm with Minkowski distance parameter p = 1.5.
The result is shown in Figure 3.
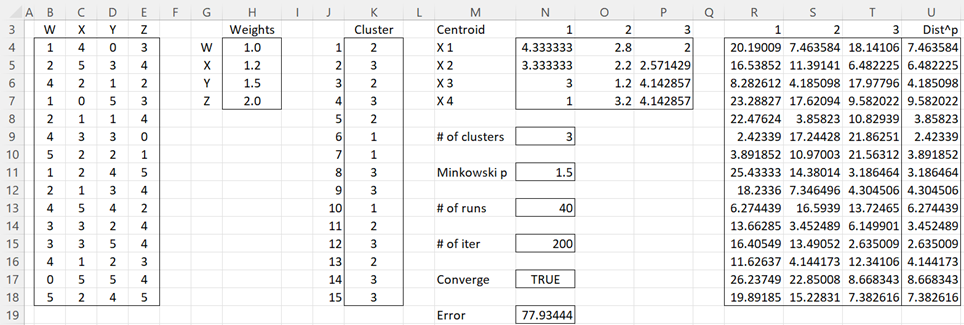
Figure 3 – k++ means cluster analysis with weights where p = 1.5
Some representative formulas from Figure 3 are shown in Figure 4.
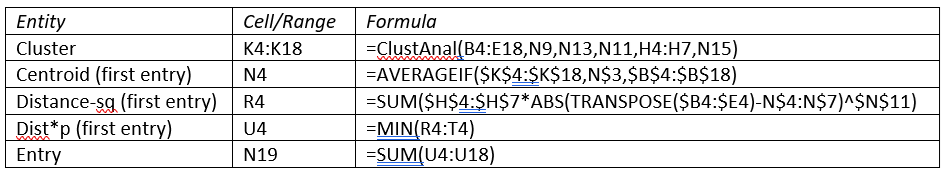
Figure 4 – Representative formulas from Figure 3
We could instead use additional Real Statistics formulas to produce the key entities in Figure 3, as shown in Figure 5.
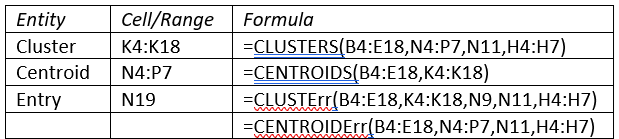
Figure 5 – Real Statistics formulas from Figure 3
Examples Workbook
Click here to download the Excel workbook with the examples described on this webpage.
References
PennState (2015) K-Mean procedure. STAT 505: Applied Multivariate Statistical Analysis
https://online.stat.psu.edu/stat505/lesson/14/14.8
Wilks, D. (2011) Cluster analysis
http://www.yorku.ca/ptryfos/f1500.pdf
Wikipedia (2015) K-means clustering
https://en.wikipedia.org/wiki/K-means_clustering
Zornoza, J. (2020) Distance metric for machine learning. Aigents
https://aigents.co/data-science-blog/publication/distance-metrics-for-machine-learning
Wikipedia (2020) Minkowski distance
https://en.wikipedia.org/wiki/Minkowski_distance
Hi Charles,
I found a possible bug in the VBA implementation of the ClustAnal function: if I try to use an nx1 array as input for Rw I get an ‘object required’ error. If I first store the array to a range and use the range object as input it does work. It would be great if it would work with an array instead of a range object.
Thank you for your great work!
Hi Harm,
Thanks for your kind words about Real Statistics.
Also, thanks for identifying this error. I see thatClustAnal only works when Rw is a range. I have identified the cause of the error and will correct it in the next bugfix release. BTW, most likely the same problem occurs for CLUST_Converge, CLUST, CLUST_Err, CENTRIODErr, INIT_CENTROIDS and INIT_CLUSTERS. A similar problem probably also exists for Rc in CLUST.
Charles