Initializing the k-means clustering algorithm
There are many ways of choosing the initial centroids in step 2 of the k-means cluster analysis algorithm. A poor choice may result in a sub-optimal minimization of the error SSE.
One approach is to simply choose the initial centroids randomly from among the elements in S (or to randomly assign data elements to clusters if you are using the second version of the algorithm). Another approach is to choose one centroid randomly and then choose the others so as to try to spread the centroids out so that they are as far apart from each other as possible.
Data Analysis Tool Options
Whichever method is chosen, we can run the complete algorithm multiple times and select the outcome that provides the least value for SSE. This is the purpose of the Number of Iterations field in the K-Means Cluster Analysis data analysis tool (as shown in Figure 2 of Real Statistics Capabilities for Cluster Analysis).
The approach that is used in the K-Means Cluster Analysis data analysis tool is called the K-means++ algorithm. If you leave the Number of Clusters field blank then this algorithm is used by default to initialize the centroids.
K-means++ Algorithm
The following definition uses the terminology introduced in K-Means Cluster Analysis. Thus, S is a data set consisting of n-tuples which is partitioned into k clusters C1, …, Ck with corresponding centroids c1, …, ck where each cj is an element in Cj.
Definition 1: The K-means++ algorithm is defined as follows:
- Step 1: Choose one of the data elements in S at random as centroid c1
- Step 2: For each data element x in S calculate the minimum squared distance between x and the centroids that have already been defined. Thus if centroids c1 ,…, cm have already been chosen define dm(x) = (dist)2(x, cj) where j = that h, 1 ≤ h ≤ m, for which (dist)2(x, ch) has the minimum value.
- Step 3: Choose one of the data elements in S − {c1 ,…, cm} at random as centroid cm+1 where the probability of any data element x being chosen is proportional to dm(x). Thus the probability that x is chosen is equal to dm(x)/
dm(z).
- Step 4: Repeat Step 2 until k centroids have been chosen
Example
Example 1: Use the K-means++ algorithm to find the initial centroids for the 4-tuples in Example 1 in Real Statistics Capabilities for Cluster Analysis. The set of 4-tuples S is repeated in columns B through E of Figure 1.
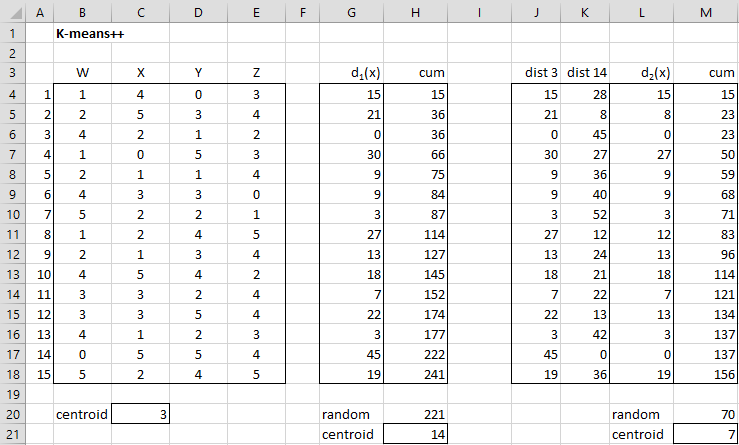
As you can see in Figure 1, the initial centroids correspond to the data elements 3, 7, and 14. We now explain how these were determined.
First centroid
The first centroid is picked at random from all the data elements using the non-volatile Real Statistics formula =RANDOM(A4,A18,TRUE) in cell C20 or the volatile Excel formula =RANDBETWEEN(A4,A18). Since this number is 3, this is the index for the first centroid.
Second centroid
To find the second centroid, we first calculate the distance squared for each of the 15 data elements to the first centroid as shown in range G4:G18. E.g. cell G4 contains the formula =SUMXMY2(B4:E4,B$6:E$6). These distances are the weights in the random selection of the second centroid.
To perform this random selection we find the cumulative values as shown in range H4:H18. We now select a random integer between 1 and 341 using the formula =RANDOM(1,H18,TRUE). This turns out to be 221 as shown in cell H20. Since 221 is bigger than 177 (cell H16) and less than or equal to 222 (cell H17), we conclude that the randomly selected data element has index 14 (cell H21), corresponding to the index for cell H17. This can be calculated using the formula
=IFERROR(MATCH(H20,H4:H18,0), IFERROR(MATCH(H20,H4:H18,1)+1,1))
Third centroid
To find the third centroid, we find the distance squared between each of the 15 data elements and the first centroid (as shown in range J4:J18) and the distance squared between each of the 15 data elements and the second centroid (as shown in range K4:K18). The smaller of these squared distances is selected as shown in range L4:L18. The process now follows using range L4:L18 as was done to find the second centroid. The result is centroid 7 (cell M21).
Figure 1 – Finding initial centroids using k-means++
Example Results
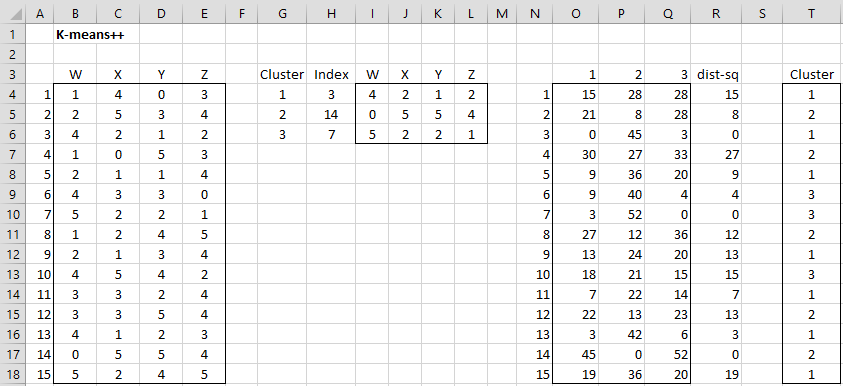
Using these results we can now find the initial clusters, as shown in range T4:T18 of Figure 2.
Figure 2 – Finding initial cluster assignments using k-means++
Observations
The formula =ClustAnal(B4:E18, 3, 0) may have returned the initial cluster values shown in range T4:T18, but because each run of this formula will use different random numbers the initial cluster assignment could be different (and in fact is quite likely to be different).
Similarly, the formula =CENTROIDS(B4:B18,3) may return the initial centroids shown in Figure 2 (actually the transpose of these values), depending on the random number generated.
Data Analysis Tool Example
Example 2: Find the cluster assignments for the fifteen 4-tuples in Example 1 of Real Statistics Capabilities for Cluster Analysis based on 3 clusters by using the Real Statistics K-Means Cluster Analysis data analysis tool and 10 iterations of the k-means++ algorithm.
The procedure for using the K-Means Cluster Analysis data analysis tool was already described for Example 1 in Real Statistics Capabilities for Cluster Analysis. This time, however, we will leave the Initial Clusters field blank in the dialog box shown in Figure 2 of Real Statistics Capabilities for Cluster Analysis. The data analysis tool will now automatically calculate the initial cluster values in each of the 10 iterations as described above.
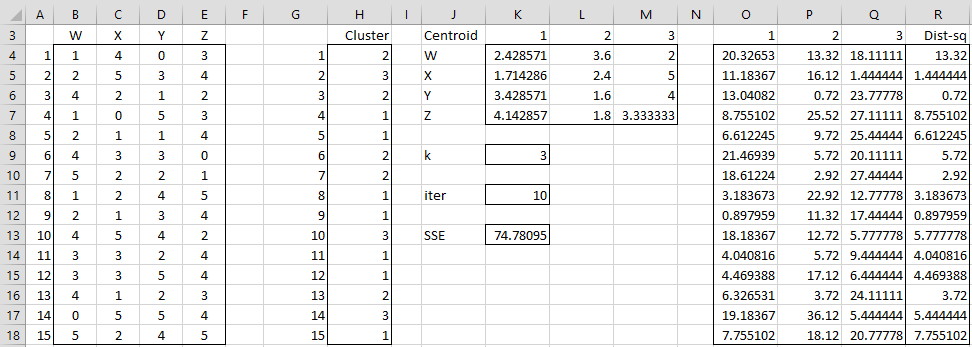
The output is shown in Figure 3.
Figure 3 – Cluster Analysis tool output using k-means++
The recommended cluster assignments are shown in range H4:H18.
Observations
Note that the algorithm won’t necessarily find an optimum solution (namely a cluster assignment that minimizes SSE). It will, however, tend to do a pretty good job. Note that the solution shown in Figure 3 is better than the one shown in Figure 3 of Real Statistics Capabilities for Cluster Analysis (since SSE of 74.78 is less than SSE of 80.83).
Note toot that output from the array formula =CENTROIDS(B4:E18, H4:H18) is shown in range K4:M7. The output in range H4:H18 can also be generated using the array formula =ClustAnal(B4:E18,3,10).
Examples Workbook
Click here to download the Excel workbook with the examples described on this webpage.
References
PennState (2015) Defining initial clusters. STAT 505: Applied Multivariate Statistical Analysis
https://online.stat.psu.edu/stat505/lesson/14/14.9
Wilks, D. (2011) Cluster analysis
http://www.yorku.ca/ptryfos/f1500.pdf
Wikipedia (2015) K-means clustering
https://en.wikipedia.org/wiki/K-means_clustering
Sharma, N. (2021) K-means clustering explained. Neptune Blog
https://neptune.ai/blog/k-means-clustering


Can anyone please explain how calculation is done for second centroid as if we take random number from the calculated distances, each time we get different number as we are selecting randomly which may lead to get different clusters.
Hello Pavan,
You can see all the calculations by downloading the spreadsheet referenced on this webpage. See
Real Statistics Examples Workbooks. Choose the Multivariate file.
Yes, this approach may yield different clusters depending on which random number is generated.
Charles
hi sir
I want to ask how the formula in section K4: K18 ?
The formula in cell K4 is =SUMXMY2(B4:E4,B$17:E$17). If you highlight range K4:K18 and press Ctrl-D you will fill in the range with the appropriate formulas. This is explained at
https://real-statistics.com/multivariate-statistics/cluster-analysis/k-means-cluster-analysis/
Charles
is it true if the C20 can change?
because in your example C20 shows number 3 while when I try the results are different
I have found the answer
in figure 3 section H4: H18 is the determination random?
excellent explanation .. understanding the “selection of a point with proportional to distance” is indeed tricky. And yours is only working example I managed to find, where it gets realized. Cumulation is key here. And cumulation with D(x)^2 simplifies things .. we may also use cumulation of D(x)^2/sum(D(x)^2). But then random number to search for will not be between 1 and 241 in example, but will be between 0 and 1.
hello sir, thanks for sharing. but im still confused with the third step where “where the probability of any data element x being chosen is proportional to dm(x). Thus the probability that x is chosen is equal to dm(x)/ \sum_{z\epsilon S} dm(z)”, and why do you use “=IFERROR(MATCH(H20,H4:H18,0),IFERROR(MATCH(H20,H4:H18,1)+1,1))” ? is it the same thing to find the next centroid? thanks
Ela
Ela,
Essentially, this formula selects a centroid at random based on the weights on column G (i.e. the distances). The bigger the d(x) value the more likely that centroid will be chosen. E.g. Since d(3) = 0 (cell G6), there is no chance that that centroid will be chosen. Since d(4) is twice d(1), it is twice as likely that centroid 4 will be chosen rather than centroid 1.
This is accomplished by taken a random number between 1 and 241 (cell H20), i.e. the number of elements, and then using the MATCH function to determine which centroid that value represents.
Charles
why you using cumulative and why you not using this formula D(x’)^2 / Sigma D(x)^2 in your implementation ?
Chandra,
I use the cumulative values so that I can calculate the centroid number using the formula
=IFERROR(MATCH(H20,H4:H18,0),IFERROR(MATCH(H20,H4:H18,1)+1,1))
I have just added this part to the referenced webpage.
I am happy to do this in another way and perhaps you are suggesting a better way. Unfortunately, I don’t quite understand your suggestion: how would you use the formula D(x’)^2 / Sigma D(x)^2. Also what is x’ and how would I implement this formula in Excel?
Charles
Charles