Data Formats
The Real Statistics Resource Pack’s implementation of Box’s Test supports two types of data formats:
Covariance Matrix Format: The data range R1 consists of an m × 2 range where m = the number of samples (i.e. the number of covariance matrices). Each row in R1 consists of the cell in the upper left corner of one of the covariance matrices being compared in column 1 and the sample size corresponding to that covariance matrix in column 2. See Figures 1 and 2 for examples of data in Covariance Matrix format.
Standard Format (without column headings): The data range R1 is an m × n range where the first column consists of the identification codes/names of the groups (i.e. independent variables) under consideration. These identification codes/names can be written in any order and repetitions are common (in fact, the sample size for each group is equal to the number of times that group identification is repeated). The remaining cells in R1 consist of data corresponding to the row identifiers. See Figure 1 of Manova Basic Concepts for an example of data in standard format.
Worksheet Functions
Real Statistics Functions: The Real Statistics Resource Pack contains the following functions, where R1 is in standard format if k = 0 (or is omitted) and R1 is in covariance matrix format if k > 0 where k = the number of dependent variables (i.e. all the covariance matrices are k × k).
BOXTEST(R1, k, f) = p-value
BOXM(R1, k) = M statistic
BOXF(R1, k) = F statistic
BOXdf1(R1, k) = df1
BOXdf2(R1, k) = df2
We also have the array function BOX(R1, k, lab) which outputs a 5 × 1 range consisting of the entries BOXM(R1, k), BOXdf1(R1, k), BOXdf2(R1, k), BOXF(R1, k) and BOXTEST(R1, k) in that order. If lab = TRUE (default FALSE), then a column of labels is appended to the output.
Additionally, BOXTEST takes an optional third parameter f which defaults to TRUE (as described above). When f is FALSE then the chi-square test is performed instead of the F test, i.e. BOXTEST(R1, k, FALSE) = p-value for the chi-square test. For Example 1, this corresponds to cell N17 in Figure 1.
Finally, the Real Statistics Resource Pack contains the following array function
COVPooled(R1, k) = pooled covariance matrix
Example with equal sample sizes
Example 1: Perform Box’s Test for the three covariance matrices shown in Figure 1 of Box’s Test Basic Concepts using the BOX function, based on three samples of size 7 each.
The key here is to create the appropriate input matrix R1 (range Y5:Z7 in Figure 1). Since there are three covariance matrices (one per each of the three samples), we need a 3 × 2 input matrix. The values in the second column will all be 7 since this is the size of all three samples.

Figure 1 – Box’s Test using the BOX worksheet function
To create the values in the first column simply click on the cell in the upper left corner of each of the covariance matrices, which for Example 1 of Box’s Test Basic Concepts are A5, A13, and G5 from Figure 1 of Box’s Test Basic Concepts. Note that the values of these cells are what you see in column Y of Figure 1. Note that you can’t simply enter the values shown in cells Y5, Y6, and Y7.
We next highlight a 5 × 1 range (range AC4:AC8 of Figure 1), enter =BOX(Y5:Z7,5), and press Ctrl-Shft-Enter to obtain the output shown in Figure 1.
Example with unequal sample sizes
Example 2: Perform Box’s Test for the two covariance matrices shown in Figure 4 of Hotelling’s T-square for Two Independent Samples using the Real Statistics functions.
This time the sizes of the two samples are not equal but are 20 and 18. We create the input matrix (P5:Q6). To create the values in the first column simply click on the cell in the upper left corner of each of the covariance matrices, which for Example 2 are A5 and A11 from Figure 4 of Hotelling’s T-square for Two Independent Samples. Note that the values of these cells are what you see in column E of Figure 2.
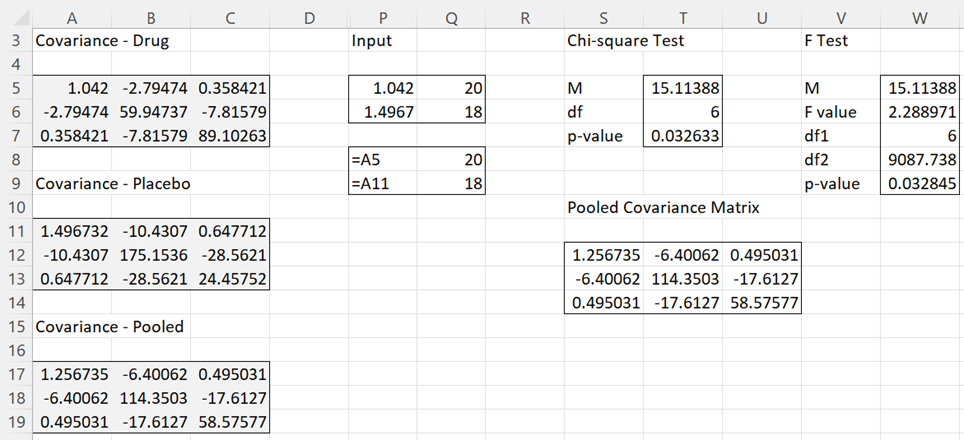
Figure 2 – Box’s Test using Real Statistics functions
In Figure 2 we see both the chi-square version of the Box Test as well as the F version. E.g. the p-value using the chi-square test (cell T7) is calculated by the formula =BOXTEST(P5:Q6,3,FALSE) and the p-value using the F test (cell W9) is calculated by the formula =BOXTEST(P5:Q6,3).
Note that the pooled covariance matrix (H12:J14) is calculated by the array function =COVPooled(P5:Q6,3).
MANOVA Example
Example 3: Perform Box’s Test for the data in Example 1 of Manova Basic Concepts using the BOX function.
Referring to Figure 1 of Manova Basic Concepts, we highlight the range I3:J7 in Figure 3, enter =BOX(A4:D35,TRUE), and press Ctrl-Shft-Enter. Figure 3 displays the results of this test. Note that the column headings (range A3:D3) are not included in the input range.

Figure 3 – Box’s Test for MANOVA using the BOX function
Data Analysis Tool
Real Statistics Data Analysis Tool: As described in Real Statistics Manova Support, the Box option of the MANOVA data analysis tool will also perform the box test for data in standard form.
Examples Workbook
Click here to download the Excel workbook with the examples described on this webpage.
References
IBM (2017) Box’s M test. IBM SPSS Statistics Algorithms
https://public.dhe.ibm.com/software/analytics/spss/documentation/statistics/24.0/en/client/Manuals/IBM_SPSS_Statistics_Algorithms.pdf
Johnson, R. A., Wichern, D. W. (2007) Applied multivariate statistical analysis. 6th Ed. Pearson
https://mathematics.foi.hr/Applied%20Multivariate%20Statistical%20Analysis%20by%20Johnson%20and%20Wichern.pdf
Rencher, A.C., Christensen, W. F. (2012) Methods of multivariate analysis (3nd Ed). Wiley
Sir
Boxtest function doesn’t work in RealStats_3.2.1
Colin
Colin,
I just tried using the BOXTEST function for Example 1 and 3 on the referenced webpage and it worked just fine. The answers iven are the same ones that appear on the webpage. I am using Release 3.2.1 on Excel 2010 in Windows 7. Which version of Excel and Windows are you now using?
Charles
Sir
I am using Office 2010 in Windows 7
Colin
Colin,
This is very strange since you are using the same configuration as me and the BOXTEST function works as before on my computer. I plan to issue a new minor release in a day or so. Let’s see if this problem goes away.
Does the BOX array function work properly? Are you able to use the Box’s test option on the MANOVA data analysis tool?
Charles
thx charles
how we can calculate it(box’s m )for equality of correlation I cant find it
?
how we can calculate it(box’s m )for equality of correlation I cant find it
How to calculate Box’s M using Real Statistics functions or the Real Statistics Manova data analysis tool is described on the referenced webpage. You need to download and install the Real Statistics Resource Pack to use these capabilities. How to calculate Box’s M manually or in normal Excel is described on the webpage https://real-statistics.com/multivariate-statistics/boxs-test-equality-covariance-matrices/boxs-test-basic-concepts/.
Charles
The functions BOXTEST, BOXM not work!!!. I try again and again and nothing. Can you review them, please?
Edu,
I just checked all the Box functions and they work fine on my computer. Do other functions from the Real Statistics Resource Pack work properly? If you send me the worksheet with the data that you are using and the formulas that don’t work properly, I will try to figure out what went wrong.
Charles