Approach
To compute statistical power for multiple regression we use Cohen’s effect size f2 which is defined by
f2 = .02 represents a small effect, f2 = .15 represents a medium effect and f2 = .35 represents a large effect.
To calculate the power of a multiple regression, we use the noncentral F distribution F(dfReg, dfRes, λ) where dfReg = k, dfRes = n − k − 1 and the noncentral parameter λ (see Noncentral F Distribution) is
![]()
Statistical Power Example
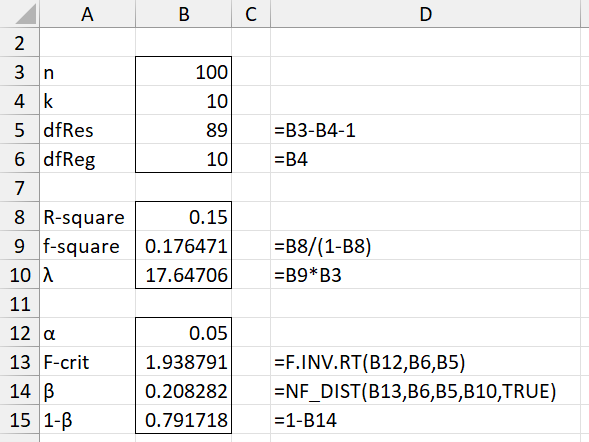
Example 1: What is the power of a multiple regression on a sample of size 100 with 10 independent variables when α = .05?
We show the calculation in Figure 1.
Figure 1 – Statistical Power
Worksheet Functions
Real Statistics Functions: The following functions are provided in the Real Statistics Pack:
REG_POWER(effect, n, k, type, α, iter, prec) = the power for multiple regression where type = 1 (default), effect = Cohen’s effect size f2 and n = the sample size. If type = 2 then effect = the R2 effect size instead and if type = 0 then effect = the noncentrality parameter λ.
REG_SIZE(effect, k, 1−β, type, α, iter, prec) = the minimum sample size required to obtain power of at least 1−β (default .80) for multiple regression where type = 1 (default) and effect = Cohen’s effect size f2. If type = 2 then effect = R2 instead.
Here α = significance level (default = .05). The calculation of the infinite sum for the noncentral F distribution stops when the level of precision exceeds prec (default 0.000000001) or the number of terms in the infinite sum exceeds iter (default 1,000).
We can, therefore, calculate the power for Example 1 using the formula
=REG_POWER(B8,B3,B4,2,B12)
Similarly, we can calculate the power for Example 1 of Multiple Regression using Excel to be 99.9977% and the power for Example 2 of Multiple Regression using Excel to be 98.9361%.
Sample Size Example
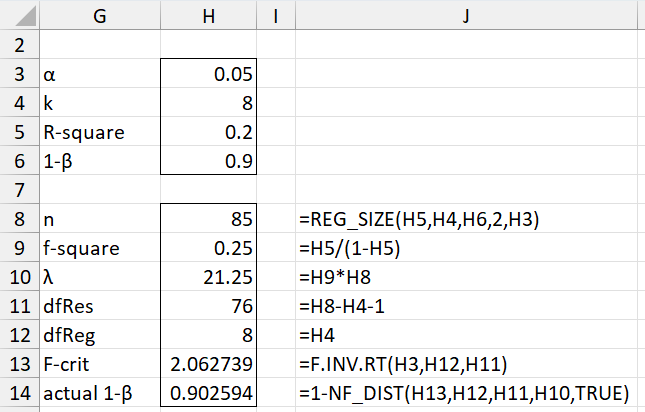
Example 2: What is the size of the sample required to achieve 90% power for a multiple regression on 8 independent variables where R2 = .2, α = .05?
We see from Figure 2 that the sample size required is 85 and the actual power achieved is 90.26%.
Figure 2 – Sample size required
Data Analysis Tool
Real Statistics Data Analysis Tool: Statistical power and sample size can also be calculated using the Power and Sample Size data analysis tool.
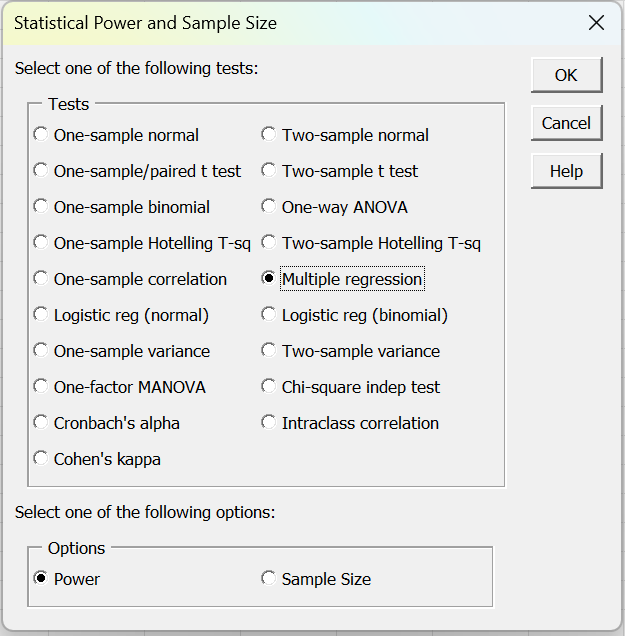
For Example 1, we press Ctrl-m and double click on the Power and Sample Size data analysis tool. Next, we select the Multiple Regression on the dialog box that appears as Figure 3.
Figure 3 – Statistical Power and Sample Size dialog box
Finally, we fill in the dialog box that appears as shown in the upper part of Figure 4. When we press the OK button the results shown in the lower part of Figure 4 appear.
Figure 4 – Multiple Regression Power dialog box
Examples Workbook
Click here to download the Excel workbook with the examples described on this webpage.
References
Faul, F., Erdfelder, E., Buchner, A., & Lang, A. G. (2009). Statistical power analyses using G*Power 3.1: Tests for correlation and regression analyses. Behavior Research Methods, 41, 1149-1160.
http://link.springer.com/article/10.3758/BRM.41.4.1149
Green, S. B. (1991) How many subjects does it take to do a regression analysis
Multivariate Behavioral Research, 26:3, 499-510
https://doi.org/10.1207/s15327906mbr2603_7


Hi Charles,
Hope you well.
Is it a bit of a mission to show the calculation behind NF_DIST to get the 0.208282 ? It’s clear how you get the f2 and the 17.64706 but I can’t really see how all the numbers fit into a final equation to give the 0.208282 in figure 1. I see you refer to the equations on Noncentral F Distribution but it’s quite complicated to make head and tail of it.
kind regards
Declan
I looked at a comment from Ryan on Noncentral F Distribution on your website, where he tried to use VBA. I compared his function against your notes.
What was the problem with it?
Just to refresh your memory, here it is:
Public Function LF_DIST(x As Double, df1 As Long, df2 As Long, lamda As Double) As Double
Dim m As Long, sum As Double, A As Double, B As Double
sum = 0
For m = 0 To 1000 Step 1
A = Application.WorksheetFunction.Poisson_Dist(m, lamda / 2, False)
B = Application.WorksheetFunction.Beta_Dist(df1 * x / (df1 * x + df2), df1 / 2 + m, df2 / 2, False)
sum = sum + A * B
Next m
LF_DIST = sum
End Function
Thanking you in advance.
regards
Declan
Hello Declan,
If I recall correctly, Ryan’s question was really about estimating the sample size required for ANOVA. The calculation uses the Noncentral F distribution.
I have checked the results I get for ANOVA sample size against G*Power’s results and have found them to be similar (probably equal).
Charles
Declan,
Yes, you are correct. The calculation of the Noncentral F distribution is complicated and relies on several other formulas. To make matters worse, the order in which you add the terms in the infnite sum is important; otherwise it will take a long time to achieve convergence.
I suggest that you simply use the NF_DIST function. If you need to code your own VBA program, you can simply call the NF_DIST function. If you need to write your own version of NF_DIST, probably one of the references on the https://real-statistics.com/chi-square-and-f-distributions/noncentral-f-distribution/ webpage will point you in the right direction.
Charles
Hello Charles,
Can you please help me with an interpretation of effect size and power?
I have a regression of which the R2 and Cohen’s d values are 0.52 and 1.1 respectively.
The regression power calculation (1-beta) is 1.0000
The lower and upper confidence intervals for the regression power are both 1.0000
Can you please help me to understand what the confidence intervals imply as they are the same as the regression power.
Thank you,
Gareth
Hello Gareth,
If the confidence interval for the power is [1,1] then you should be pretty sure that the power is 100% (actually 100% confident).
I didn’t check to see whether this is possible, but I did see that for R2 = .52, f-sq = 1.08333 and if the sample size is n = 50, you do achieve 100% power if you have 1 independent variable. I didn’t calculate the confidence interval.
Charles
Thank you Charles!
Hi there!
Thanks a lot for your great work. I wish to use this information in a response to a reviewer for publishing an article. Is it possible to provide a published reference, paper to attach my answer? thanks in advance
Carlo,
Sorry, but I don’t understand your question. Accetto anche una domanda in italiano.
Charles
Hi Charles,
Thank you for the resources, they are very helpful. From reading your responses, you have the patience of a saint and I hope you have enough left for my query.
I would like to run multiple regression on 70 responses. I have 5 independent variables.
I’ve downloaded the toolkit and used the power function to get the R-sq effect type. I’ve inputted sample size (70) and number of predictors (5). I randomly put in 0.15 as the effect size as I’m not sure how to calculate that. It gave me 0.74 as the power. I would be very grateful if you could tell me if I have used the tool correctly and if my sample size is adequate?
Many thanks,
a very stressed undergrad
Hi Jess,
Yes, your calculation is correct. Your sample size is adequate provided you need to discover an effect size of R-sq = .15. This seems quite reasonable for many such regression analyses.
Charles
Thanks very much Charles!
Hello Sir.
I need a small clarification regarding multiple linear regression.
Can I run a regression model even if the samples size for the dependent and independent variable varies?
For example, if the size of dependent variable is 50 and independent variable is 150, can I run a model?
If not, pls tell me how to proceed with this.
I do not have missing values.
Hello Mitra,
For each independent variable value, you must have a dependent variable value. Thus, the sample sizes can’t be different (allowing for repeated values).
What are you trying to accomplish? Can you give me an idea of what your data looks like?
Charles
Halo sir,
Please help.
I downloaded Real Statistics Data Analysis Tool. I follow steps about pressing Ctrl-m and double click on the Power and Sample Size data analysis tool, then select the Multiple Regression on the dialog box that appears, I fill in the dialog box that appears as shown in the upper part of Figure 4. When I press the OK button the new box is open and I get this message: “Compile error in hidden module: frmRegPower”. Can you please advise me what I do wrong. Thank you in advance. Maria
Hi Maria,
See Compile Error in Hidden Module
Charles
I did it!
Thank you very much Mr Charles.
Best regards.
Maria
It is me again.
How can I determine effect size for a sample size of 192 and 11 variables? Is the effect size same as r-square in the above Figure 4? How can be explained and what does it mean if the power of multiple regression test is 60.16% or 79.17%, 90% etc… Do you somewhere have a good explanation for that on Your website?
Thank you, thank you….
Hello Maria,
As explained on this webpage, f^2 is the typical measure of effect size for multiple regression. Since f^2 = R^2/(1-R^2), you can also use R^2 as a measure of effect size.
See the following webpage for an explanation of statistical power:
Statistical Power
Charles
Hi Charles,
Your explanations on the website are very helpful. Thank you.
I understand that this calculation is used when I am interested in the regression model as a whole. What if I am using regression to adjust for a confounders. For example, I am studying the effect of drug dose on glucose levels in different patients but I need to adjust for the use of insulin and the baseline blood glucose. So I will be using drug dose, insulin use and baseline glucose as predictor variables.
Can I still use the overall R squared to determine the sample size or there is a method that differentiates between the main predictor variable of interest and the confounder variables?
Mohamed,
I believe that you would still use the overall R squared value. Since you are using both types of variables in your model, I would think that you need to account for both types in the estimate of sample size.
Charles
Hi Charles,
A rule of thimb in many statistics say that 30 points is a minimum sample size to calculate the multiple regression analysis. My question is : this 30 points is for each independent variable or for all the variables together. Meaning, if we have 3 independent variables each has 10 points, is that enough or Each should have 30 points?
Hello Neveen,
No, you would need 90 points (30 x 3).
Charles
I sent you an email the other day and you answered me that the sum of readings is the right answer and not for each variable. I m really confused .
What is the minimum points needed for a multiple regression for each indepentend variable?
Neveen,
I have now answered this question for you twice. Please explain what is confusing you.
Charles
Hi Mohamed
Thanks for your perfectly phrased question,
I was looking for your exact case, sample size calculation in the regression analysis for confounders adjustment
need your help
thanks in advance
I created a spreadsheet using the values on this page, and downloaded the package. However, I get an incorrect value for NF-dist. Your sheet shows 0.208282. I get 1.05149E-5. Did I do something wrong? First numbers in each row below are my values, the second number is your example.
n 100 100
k 10 10
dfRes 89 89
dfReg 10 10
R-sq 0.4 0.4
f-sq 0.666666667 0.666666667
λ 66.66666667 66.66666667
α 0.05 0.05
F-crit 1.938791309 1.938791309
β 1.05149E-05 0.208282
1-β 0.999989485 0.999989485
Thanks for what you do.
David,
If you send me an Excel file with your data, I will try to figure out what is doing on.
Charles
Thanks. I sent you the spreadsheet. I have some more general questions which I include here:
Is the power calculation influenced by the use of stepwise regression, where there may be many more potential independent variables than are used in the final model?
This could be critical if you are including interaction terms.
For example, if there are ten independent variables, the interaction terms could include x1*x2, x1*x3, … x1*x2*x3, … all the way to Productsum(x(i)) i = 1…10. In this case, there are 1024 possible candidate “independent variables,” including the synthetic ones. Yet the final model might have only a few terms.
On one hand, we don’t want to be guilty of “p-hacking” by creating so many candidate terms. On the other hand, we don’t want to miss relationships that may exist in the data.
One could include multivariate polynomial terms such as x1*x3^2, x3*x5^-1, etc. Then there may be many more candidate terms. The website I linked to does this kind of calculation.
Regards, Dave.
Dave,
The problem is that there are an infinite number of possible terms to include (besides the ones you have mentioned, there are potentially LN(x1), exp(x1), x1^2, x1^3, x1^4, x1^x2, sin(x1), etc.). You need to use some judgement to determine which such terms are reasonable. Often there are some theoretical consideration, but sometimes you need to create a plot if the data to see which terms are likely to matter. Also you might do a little trial and error.
Charles
Sir, This paper is very very helpful. But I am not understanding why – but when i am doing your example in excel (example 1), the last formula for calculating Beta is not coming – means – i am typing the formula NF_DIST, but it is showing ‘ERROR’.
Please help.
Anupam,
I don’t know what the cell value of ERROR means. Usually if there is an error, you would see one of the following #DIV/0, #N/A, #NUM!, #VALUE!, #NAME?, #NULL! or #REF!
What release of the Real Statistics software are you using? You can enter =VER() to find this out.
Charles
Thank you for the clear and insightful articles here. I wondered what advice you have for conducting a multiple regression-type analysis but with unavoidably low sample sizes? My dataset appears to meet the other assumptions of regression, but has only 19 observations, with two independent variables I’d like to explore against a continuous dependent (actually multiple dependents but I will run each one separately). One independent variable is categorical, the other continuous. Any advice on the best course of action with small samples would be much appreciated! Thank you
Emily,
You can run multiple regression even with a small sample size. The small sample size will simply limit the power of the test.
Charles
Thank you Charles for your speedy reply!
Emily