We now show how to use the Ridge Regression Regression data analysis tool to calculate the regression coefficients and other important statistics for Ridge regression.
Data Analysis Tool
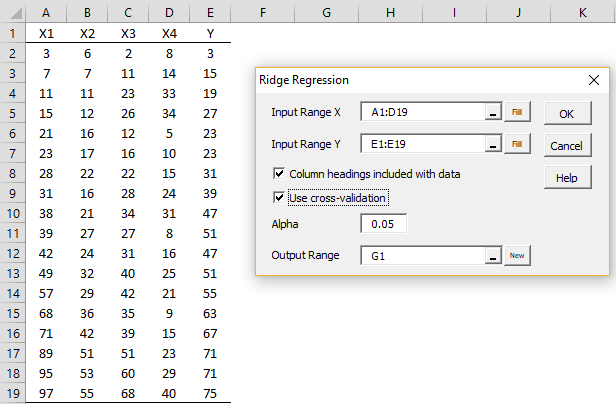
Real Statistics Data Analysis Tool: To use the Ridge Regression data analysis tool for Example 1 of Ridge Regression Example press Ctrl-m and double-click on the Regression option in the dialog box that appears (or click on the Reg tab when using the multipage interface). Next, select Ridge Regression from the list of options and fill in the dialog box that appears as shown in Figure 1.
Figure 1 – Ridge Regression dialog box
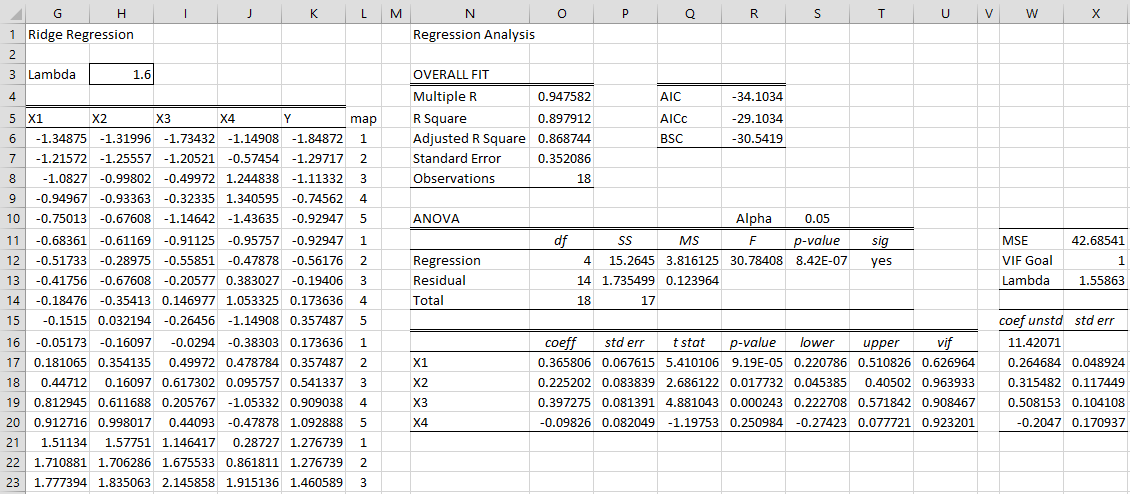
After pressing the OK button, the output shown in Figure 2 and 3 appear.
Figure 2 – Ridge Regression analysis (part 1)
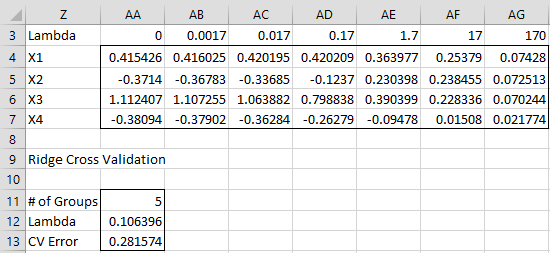
Figure 3 – Ridge Regression analysis (part 2)
Observations
Actually, when the output in Figure 2 first appears the lambda value of .17 appears in cell H3. This is .01 times n–1 where n = the number of sample elements, which in this case is 18. I manually changed this value to 1.6 (based on trying to keep all the VIF values below 1, as explained previously). Note too that 1.6 is just a little higher than the value of cell X13 shown in Figure 2).
The table in range Z3:AG7 of Figure 3 is also used to produce the Ridge Trace as shown in Figure 1 of Estimating the Ridge Regression Lambda.
For this problem, I ignored the lambda value produced by cross-validation since it seems too low based on the Ridge Trace and VIF approach.
Finally, note that the value of 42.685 for MSE shown in cell X11 is not the same as the MSE value shown in cell Q13. This MSE value is that for the Ridge regression model based on the unstandardized coefficients shown in range W16:W20.
Worksheet Function
Real Statistics Function: The Real Statistics Resource Pack provides the following function.
RidgeMSE(Rx, Ry, lambda) = MSE of the Ridge regression defined by the x data in Rx, y data in Ry, and the given lambda value.
Examples Workbook
Click here to download the Excel workbook with the examples described on this webpage.
References
bquanttrading (2015) Ridge regression in Excel/VBA
https://asmquantmacro.com/2015/12/11/ridge-regression-in-excelvba/
Marquardt, D. W. and Snee, R. D. (1975) Ridge regression in practice. The American Statistician
https://web.archive.org/web/20170809092848/http://www.jarad.me/stat615/papers/Ridge_Regression_in_Practice.pdf
PennState (2018) Ridge regression. Applied Data Mining and Statistical Learning
https://online.stat.psu.edu/stat857/node/155/


Dear Mr. Zaiontz,
Could you please explain why the total number of degrees of freedom is 18 (cell O:14), the same as the number of observations? Shouldn’t we have n-1 = 17 = df, as in an OLS regression?
Best regards
Roland
Hello Roland,
This is because you are performing linear regression without an intercept. See
https://real-statistics.com/multiple-regression/ridge-and-lasso-regression/ridge-regression-example/
https://real-statistics.com/multiple-regression/multiple-regression-without-intercept/
Charles