Excel Capabilities
The following Excel functions, also described in Multiple Regression Analysis in Excel, can be used for regression without an intercept. In this case, the con argument is set to FALSE (con = TRUE is the default).
TREND(R1, R2, R3, con) = array function which predicts the y values corresponding to the x values in R3 based on the regression line based on the x values stored in array R2 and y values stored in array R1. If R3 is omitted it defaults to the range R2.
LINEST(R1, R2, con, TRUE) = array function which outputs a 5 × k range where k = the number of independent variables (plus 1 if con = TRUE), as described Multiple Regression Analysis in Excel.
Excel’s Regression data analysis tool, as described in Multiple Regression Analysis in Excel, you can force the constant term to be zero by checking the Constant is Zero option.
Worksheet Functions
Real Statistics Functions: You can use the following Real Statistics functions for regression without an intercept by setting the con argument to FALSE (con = TRUE is the default).
In the following R1 is an n × k array containing the X sample data and R2 is an n × 1 array containing the y sample data.
| SSRes(R1, R2, con) = SSRes | dfRes(R1, R2, con) = dfRes | MSRes(R1, R2, con) = MSRes |
| SSReg(R1, R2, con) = SSReg | dfReg(R1, R2, con) = dfReg | MSReg(R1, R2, con) = MSReg |
| SSRegTot(R1, R2, con) = SST | dfRegTot(R1, R2, con) = dfT | MSRegTot(R1, R2, con) = MST |
| MultipleR(R1, R2, con) = R | RSquare(R1, R2, con) = R2 | AdjRSquare(R1, R2, con) = Adjusted R2 |
| RegSE(R1, R2, con) = standard error | REGF(R1, R2, con) = F-stat | RegTEST(R1, R2, con) = p-value |
HAT(R1, con) = n × n hat matrix
LEVERAGE(R1, con) = column range which contains the diagonal elements of the hat matrix
RegCoeff(R1, R2, con) = k × 2 range consisting of the regression coefficient vector followed by a vector of standard errors of these coefficients if con = FALSE (the output is a k+1 × 2 range if con = TRUE, to include the intercept coefficient and its standard error)
RegY(R1, R2, con) = n × 1 vector of predicted values for y values in R2
RegE(R1, R2, con) = n × 1 residuals vector for y values in R2
RegAIC(R1, R2, con, aug) = Akaike’s Information Criterion (AIC)
RegAICc(R1, R2, con, aug) = corrected Akaike’s Information Criterion (AICc)
RegSBC(R1, R2, con, aug) = Schwarz Bayesian Criterion (SBC)
The second argument R2 in the dfRes, dfReg and dfTot are optional (actually, this argument is not used).
Comparison with Regression with Intercept
In the case of regression without an intercept, the values of various statistics such as AIC, AICc, SBC, VIF, Tolerance, Cook’s D, DFFITS, etc. are the same as for multiple linear regression with an intercept, except that the definitions given in Multiple Regression without Intercept of dfRes, SSRes, correlation vector B, hat matrix H, R2, etc. are used and whenever k appears it is replaced by k – 1.
More Real Statistics Capabilities
Real Statistics Data Analysis Tool: The Linear Regression data analysis tool described in Real Statistics Capabilities for Multiple Regression has an option to perform regression without an intercept, as described in the next example.
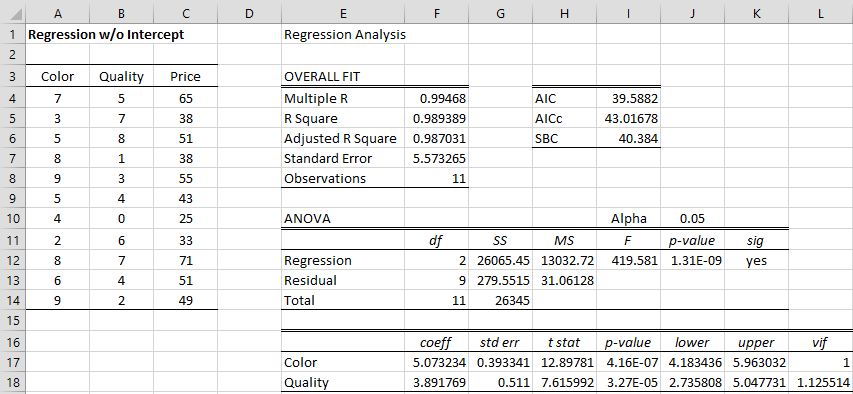
Example 1: Repeat Example 2 of Multiple Regression Analysis in Excel using a linear regression model without intercept (see Figure 1 for a copy of the data)
Enter Ctrl-m and select Multiple Linear Regression from the Reg tab (or double-click on the Regression option and select Linear Regression if using the original user interface). Next, fill in the dialog box that appears as shown in Figure 2 of Real Statistics Capabilities for Multiple Regression, except that this time you need to uncheck the Include constant (intercept) option. When you click on the OK button the output shown in Figure 1 appears.
Figure 1 – Linear regression without an intercept
Note that the range F17:G18 contains the array worksheet formula =RegCoeff(A4:B14,C4:C14,FALSE) and cell F6 contains the formula =1-(1-F5)*F8/(F8-F12), although we could have used the formula =AdjRSquare(A4:B14,C4:C14,FALSE) instead.
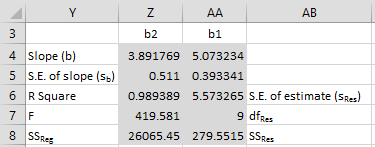
We could also use the array formula =LINEST(C4:C14,A4:B14,FALSE,TRUE) to calculate key values in the linear regression without intercept, as shown in Figure 2 (the labels have been added manually).
Figure 2 – Use of LINEST function
More Examples
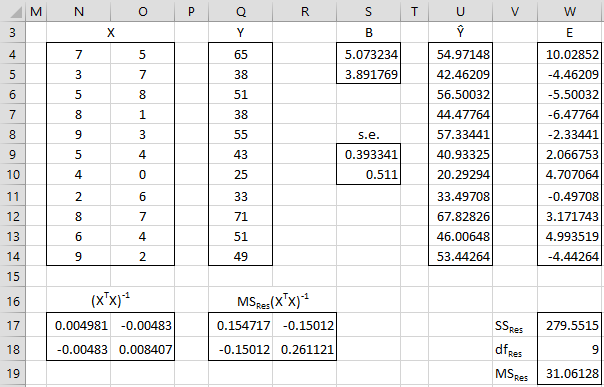
Example 2: Calculate the linear regression coefficients for the data in Example 1 using matrix techniques.
We use the same approach as in Multiple Regression using Matrices, with the modifications described in Multiple Regression without Intercept. The result is shown in Figure 3.
Figure 3 – Matrix approach to linear regression without an intercept
Observation
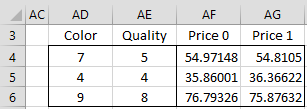
As shown in Figure 3 of Real Statistics Capabilities for Multiple Regression, when we perform linear regression with an intercept on the data in Figure 1, it turns out that the intercept coefficient is not significantly different from zero (p-value = .808). Thus it isn’t too surprising that predictions based on the models with and without an intercept won’t be very different. We can see this in Figure 4.
Figure 4 – Comparison of forecasts
Here, the forecasted price using the model with intercept (Price 1) is compared with the forecasted price using the model without intercept (Price 0) for three diamonds. E.g. the price of a diamond with color and quality of 4 is estimated to be 35.86 based on the non-intercept model and 36.37 based on the model with intercept.
Examples Workbook
Click here to download the Excel workbook with the examples described on this webpage.
Reference
Eisenhauer, J. G. (2003) Regression through the origin. Teaching Statistics. Volume 25, Number 3.
http://web.ist.utl.pt/~ist11038/compute/errtheory/,regression/regrthroughorigin.pdf


Hello Charles,
is it appropriate to use multiple regression through the origin in this fashion:
y[t] = b1*x1[t]+b2*x2[t]+b3*x3[t] ..
where x[t] are index variables and y[t] is their total/or average?
What would be the interpretation of the coefficients?
Is it sensible to draw any inference from the results?
Thanks
Please explain what you mean by x[t] are index variables and y[t] is their total/or average.
Charles
The expression “with / without intercept” is confusing. Of course there is always an intercept. The intercept is either estimated or stipulated. estimated is the default. When the intercept is stipulated,R2 is computed differently in the graphics than in the analysis pack regression module, without explanation and both have as different meaning than when intercept is estimated. Let y be the indep vbl with mean y*, let y^ be the regression estimate based on x. let SS = sum(yi-y*)^2; SSR = sum(yi^ – y*)^2; SSres = sum(yi-yi^)^2. If the intercept is estimated then SS = SSR + SSres, and R2 = SSR/SS = 1-SSresid/SS. R2 has the clear meaning as % explained variance. If the intercept is stipulated, then SS# = sum(yi^2), SSR# = sum((yi^)^2) and R2 = SSR#/SS#, which may obviously be > 1. In the graphics, R2 = 1-SSres/SS which of course can be negative. To a mathematician this is utter lunacy. And of course no explanation is given.
My question: if the intercept is stipulated, how is adjR2 calculated?
Hello Roger,
I agree with your comments. What specific changes do you suggest that I make to the website and Real Statistics software?
AdjRSquare = 1 – (1 – RSquare(xarray, yarray, False)) * m / (m – n) where m = # of data elements (i.e. # of rows in xarray), n = # of independent variables (i.e. # of columns in xarray) and RSquare is as calculated by Excel’s LinEst(yarray, xarray, False, True) formula.
Charles
Hello, Charles!
How to calculate standard error for independant variables? When I used STDEV.S/SQRT(n) formula the number I got was different, than what I see in the table from Real Statistics and what excel calculated on its own. It means that there’s something wrong with the formula I’m using.
What formula should be to calculate standard error in excel manually (so that it’s the same as in tables I get automatically)
With appreciations to your site and work,
Evgeniya
Hello Evgeniya,
The formula is STDEV.S(R1)/SQRT(COUNT(R1)) where R1 is the range containing the data.
But the standard error for regression coefficients is calculated in a different way. What specific standard error are you trying to calculate? How does it pertain to regression through the origin (the subject of this webpage)?
Charles
Charles,
thanks a lot for your quick reply!
I’m trying to calculate each parametr of a regression manually on my own to create a list with a lot of formulas to make quick analyses all at once when i insert data. So now I’m stuck at calculating coefficients’ errors in a regression model.
Searching for the answser in the Internet I have found only one formula that I wrote before, that doesn’t work as it turned out to be.
What is the formula I need for regression coefficients?
On this webpage you show detailed calculations, but haven’t found what looking for.
Evgeniya
Hello Evgeniya,
If you are referring to OLS multiple regression with an intercept term, then the formulas for coefficients and their standard errors are provided at
https://real-statistics.com/multiple-regression/multiple-regression-analysis/multiple-regression-using-matrices/
More details and an example are given at
https://real-statistics.com/multiple-regression/multiple-regression-analysis/multiple-regression-analysis-excel/
If you only have one independent variable, then things get much simpler and you don’t need to use matrices.
Charles
Hello, Charles!
I’m performing Multiple linear regression and trying to find errors for X1, X2, X3, X4, X5 and Intercept.
I checked the links and didnt find the answer. I’m looking for a formula in excel that will calculate standard deviation of each listed variables, so that i could get standard errors and p-values.
How to calculate it if the formula STDEV.S(R1)/SQRT(COUNT(R1)) where R1 is the range containing the data doesn’t work?
Hello Evgeniya,
In Excel you need to use the LINEST array function to do this.
In Real Statistics you can use the RegCoeff function
Charles
Thanks a lot! I need to use this function and then select the tablle with n cells (where n=number of all variables) horizontally and 5 cells vertically. Then press Ctrl+Shift+Enter.
The first row is the coefficients, the second – standard error with the opposite direction of the variables.
Basically it’s a very quick regression table, finally i learned how to perfoem it without any additional tools installed.
Actually, the first column contains the regression coefficients, the second column contains the corresponding standard errors.
Charles
Your statement “regression without an intercept when the con argument is set to FALSE (con = TRUE is the default)” is wrong. Without intercept is the default.
https://postimg.cc/image/yla3stkd3/
I believe that con = TRUE is the real default. Try using the following data:
x = 0, 1, 2, 3 and y = 5, 6, 7, 8. You’ll see that the regression doesn’t go through the origin.
Charles
Sir,i want to predict diesel engine performance, by using eq.in the form as,Torque,T=(a1R+a2R^2+a3R^3)+(a4R+a5R^2+a6R^3)*Z+(a7R+a8R^2+a9R^3)*Z^2, here i want to find 9 coeff.with 30 data set ofT,Z&R.tnx
Rakesh,
Perhaps you can use Solver as described in many places on the website. See, for example
https://real-statistics.com/regression/exponential-regression-models/exponential-regression-using-solver/
Charles