Basic Approach
If the X coefficient is still significant when testing requirement 4 of Mediation Analysis Basics, we can use the Sobel test for testing requirement 4. This test determines whether the complete path a + b described on that webpage is significant. This is done as shown in range F13:J16 of Figure 4 of Mediation Analysis Basics, and is repeated here in Figure 1.
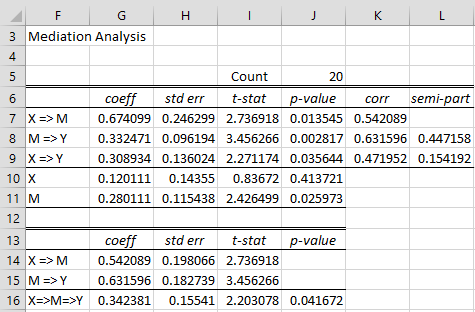
Figure 1 – Mediation Analysis
Explanation
This approach uses standardized regression coefficients. In particular, the standardized regression coefficient for X in path a is .542(cell G14) as calculated by the formula
=SUBMATRIX(StdRegCoeff(C4:C23,B4:B23),2,1)
Similarly, the standard regression coefficient for M in path b is .632 (cell G15) as calculated by the array formula
=SUBMATRIX(StdRegCoeff(B4:B23,D4:D23),2,1)
The regression coefficient for path a + b is .342 (cell G16), as calculated by =G14*G15. The t statistic for path a (cell I14) is the same as that shown in cell I7, and the t statistic for path b (cell I15) is the same as that shown in cell I8. Now t-stat = coeff/se and so se = coeff/t-stat. Thus, we obtain the standard errors corresponding to the standardized coefficients (cells H14 and H15) by using the formulas G14/I14 and G15/I15. The key step is that the standard error for the path a + b can now be calculated using the formula
![]()
Thus, the standard error in cell H16 can be calculated by =SQRT((G14*H15)^2+(H14*G15)^2-(H14*H15)^2). The corresponding t statistic (cell I16) is calculated by F16/H16 and finally, the p-value (cell J16) is .0417 as calculated by the formula =T.DIST.2T(ABS(I16),J5-3).
Since p-value = .0417 < .05 = α, we have a significant result, supporting requirement 4, and once again demonstrating that we have a mediating relationship.
Examples Workbook
Click here to download the Excel workbook with the examples described on this webpage.
References
Kenny, D. A. (2021) Mediation
https://davidakenny.net/cm/mediate.htm
Baron, R. M., & Kenny, D. A. (1986). The moderator-mediator variable distinction in social psychological research: Conceptual, strategic and statistical considerations. Journal of Personality and Social Psychology, 51, 1173-1182.
http://dx.doi.org/10.1037//0022-3514.51.6.1173
Hi Charles,
For your interest, I came across a discussion of a problem with the Sobel test. This is discussed at the bottom of page 675 of the article below:
https://journals.sagepub.com/doi/10.1177/1094428115627498
Best Regards,
Gareth
Hi Gareth,
Thanks for sending me the link, but I was not able to access the article.
Charles
Dear Charles,
If M=>Y and X=Y are both significant and X rises considerably (which together suggests requirements 1 to 4 are met) but M is non-significant, how should I interpret that? Sobel’s Test indicates a marginally significant p-value (0.0507).
Since the tool only allows for single columns of data to be selected, would it be legitimate to use the predicted y values for the three input variables (taken from Cook’s D) for separate regressions of each variable that includes control variables to reduce omitted variable bias?
For some reason, when performing this analysis both the semi-part fields don’t return a result. instead I see the formula for both (e.g. “=SEMIPART_CORREL(AC133:AC208,AZ6:AZ81,U4:U79)”. I’ve just installed the latest version of the software- 8.6.2 Excel 2010/2013/2016/2019/2021/365 Windows – so probably that’s not it.
I get the same for all the upper intervals for a regression on the same worksheet (e.g. “=AE19+T.INV.2T(AI$12,$AE$15)*AF19”)
Thank you kindly,
Gareth
Hello Gareth and sorry for the very late response.
I don’t know what =SEMIPART_CORREL(AC133:AC208,AZ6:AZ81,U4:U79) refers to since the relevant spreadsheet doesn’t have any data in columns U, AC or AZ.
Charles