Basic Approach
Since our goal is to minimize the absolute value of the difference between the observed values of y and the values predicted by the LAD regression model
we first note that
In this way, we turn the LAD regression problem into a weighted regression problem. Since the weights depend on the regression coefficients, we need to use an iterative approach, estimating new weighted regression coefficients based on the weighted regression coefficients at the previous step. Fortunately, this approach converges to a solution (based on the initial guess of the weights).
Example
Example 1: Repeat Example 1 of LAD Regression using the Simplex Method using the iteratively reweighted least-squares (IRLS) approach.
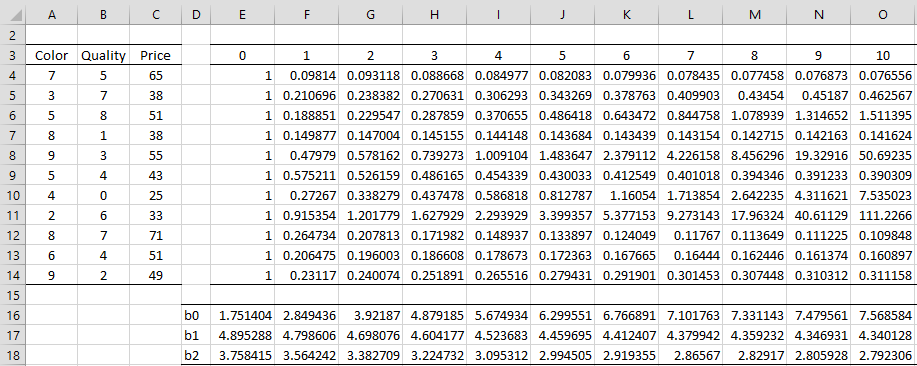
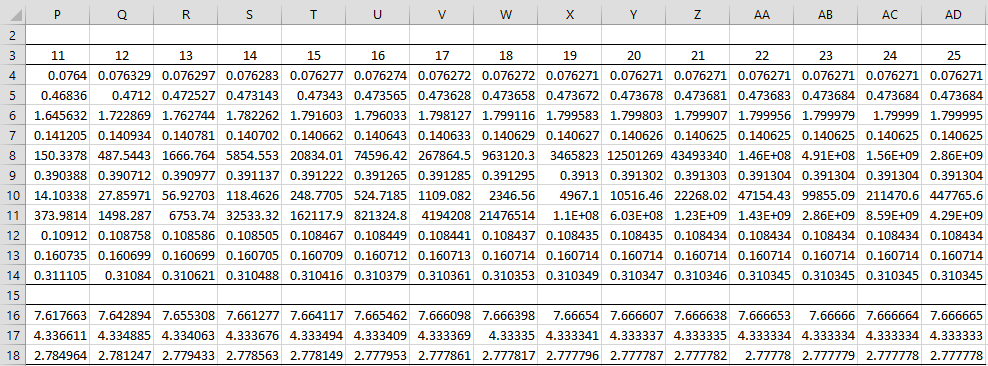
The first 10 iterations are shown in Figure 1 and the next 15 iterations are shown in Figure 2.
Figure 1 – LAD using IRLS (part 1)
Figure 2 – LAD using IRLS (part 2)
Here, we set the initial weights to 1 in range E4:E14. Using these weights, we run a weighted linear regression on the original data (shown in range A3:C14) to obtain the regression coefficients shown in range E16:E18, using the Real Statistics array formula
=WRegCoeff($A4:$B14,$C4:$C14,E4:E14)
For the next iteration, we calculate new weights using the regression coefficients in range E16:E18. These new weights are shown in range F4:F14. E.g. the weight w1 (in iteration 1), shown in cell F4, is calculated using the formula
=1/ABS($C4-(E$16+$A4*E$17+$B4*E$18))
The other 10 weights at iteration 1 can be calculated by highlighting range F4:F14 and pressing Ctrl-D. We can now calculate new regression coefficients based on these weights as shown in range F16:F18. In fact, we can obtain the rest of the worksheet by highlighting the range F4:AD14 and pressing Ctrl-R. We next highlight the range E16:AD18 and press Ctrl-R.
We see from Figure 2 that after 25 iterations, the LAD regression coefficients are converging to the same values that we obtained using the Simplex approach, as shown in range F15:F17 of Figure 3 of LAD Regression using the Simplex Method.
The advantage of the iteratively reweighted least-squares approach to LAD regression is that we can handle samples larger than 50.
Worksheet Functions
Real Statistics Functions: For the following array functions, R1 is an n × k array containing the X sample data, R2 is an n × 1 array containing the Y sample data, con takes the value TRUE for regression with an intercept FALSE for regression without an intercept, and iter is the number of iterations performed (default 25).
LADRegCoeff(R1, R2, con, iter) = column array consisting of the LAD regression coefficients; output is a k+1 × 1 array when con = TRUE and a k × 1 array when con = FALSE
LADRegWeights(R1, R2, con, iter) = n × 1 column range consisting of the weights calculated from the iteratively reweighted least-squares algorithm
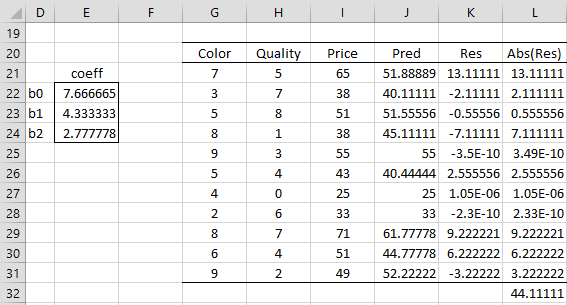
For example, the output from the formula =LADRegCoeff(A4:B14,C4:C14) is as shown in range E22:E24 of Figure 3.
Figure 3 – Real Statistics LADRegCoeff function
We also show how to calculate the LAD (least absolute deviation) value by summing up the absolute values of the residuals in column L to obtain the value 44.1111 in cell L32, which is identical to the value we obtained in cell T19 in Figure 3 of LAD Regression using the Simplex Method. Note that to calculate the value of Price predicted by the model for the first x values (cell J21) we used the formula =RegPredC(G21:H21,$E$22:$E$24).
The formula =LADRegWeights(A4:B14,C4:C14) produces the output shown in range AD4:AD14 of Figure 2.
Note that the version of IRLS in the case without a constant term is similar to how ordinary least squares is modified when no constant is used as described in Regression without an Intercept.
Additional Information
See Standard Errors of LAD Regression Coefficients to learn how to use bootstrapping to calculate the standard errors of the LAD regression coefficients.
See LAD Regression Analysis Tool to learn how to calculate the regression coefficients as well as their standard errors and confidence intervals automatically using the Real Statistics LAD Regression data analysis tool.
Examples Workbook
Click here to download the Excel workbook with the examples described on this webpage.
References
Wikipedia (2016) Least absolute deviations
https://en.wikipedia.org/wiki/Least_absolute_deviations
Wikipedia (2016) Iteratively reweighted least squares
https://en.wikipedia.org/wiki/Iteratively_reweighted_least_squares
Thanoon, F. H. (2015) Robust regression by least absolute deviations method
http://article.sapub.org/10.5923.j.statistics.20150503.02.html


