Basic Concepts
Sometimes the dependent variable depends not just on the independent variables but also on the interaction between the variables. The regression model to use in this case is:
This is equivalent to a usual multiple regression model
studied in Multiple Regression Analysis where x3 = x1 · x2.
Example
Example 1: We postulate that the amount of votes a candidate gets depends on the amount of amount of money they spend and their quality (position on issues, ability to debate, charisma, organizational abilities, etc.). The table on the left of Figure 1 shows the percentage of votes 10 candidates received in different elections along with the amount of money spent and their quality. Determine the relationship between votes, money and quality.
Figure 1 – Data for Example 1 plus interaction model
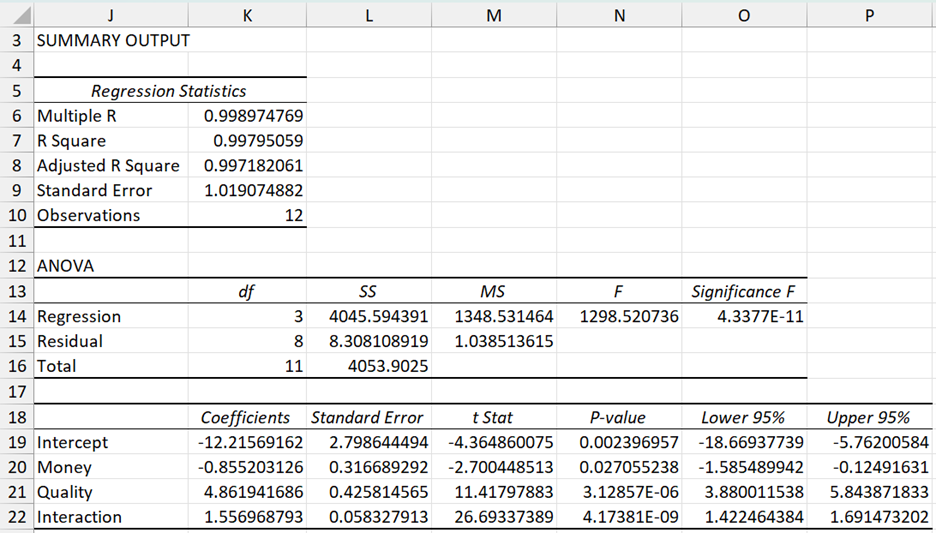
To capture the interaction between money and quality, we add an independent variable called “Interaction” (as described in the table on the right of Figure 1). Interaction is simply the product of the money and quality values. We now use the Regression data analysis tool on the interaction model. The resulting output is shown in Figure 2.
Figure 2 – Regression with interaction
This model is almost a perfect fit for the data (99.7% Adjusted R Square), and shows that we can predict the percentage of votes a candidate will get via the formula:
Votes = -12.22 – 0.86 * Money + 4.86 * Quality + 1.56 * Money * Quality
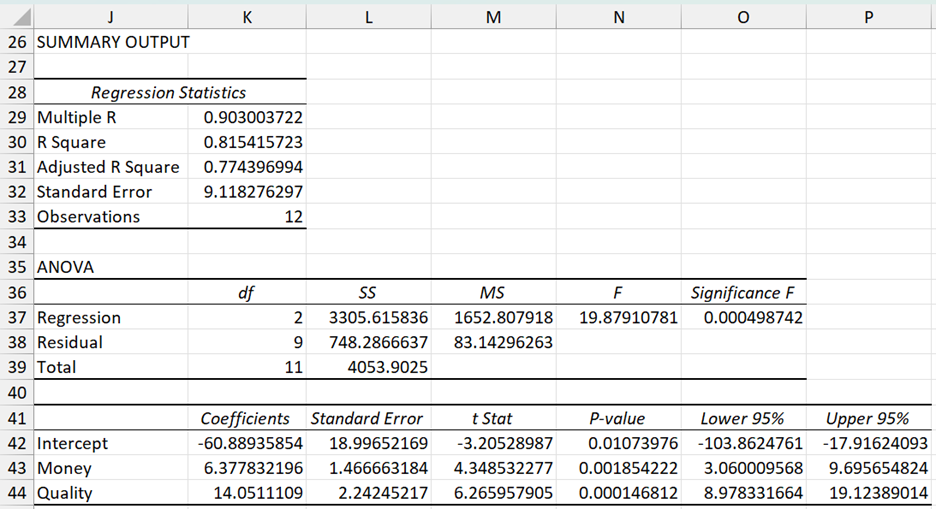
We can also run the Regression data analysis tool on the original data without the interaction variable, obtaining the output in Figure 3.
Figure 3 – Regression without interaction
This model is also a good fit for the data (p-value = 0.000499 < .05 = α), but with an Adjusted R Square value of 77.4%, not quite as good as the model with interaction.
Data Analysis Tool
We can use the Real Statistics Extract Columns from a Data Range data analysis tool to automate the process of creating the interaction between two variables.
For example, to create the interaction between Money and Quality in Example 1, press Ctrl-m and select Extract Columns from a Data Range from the Desc tab. Now enter A3:D19 into the Input Range of the dialog box that appears (as described in Figure 4 of Categorical Coding in Regression) and press the OK button.
Now, select both Money and Quality from the list box in the dialog box that appears as shown on the right side of Figure 4 (by clicking on Money and, while holding down the Ctrl key, clicking on Quality) and press the Add Inter button. Since neither Money nor Quality has yet been added to the output, these too are copied over along with the interaction. The result is as shown in range E4:G16 of Figure 4.
Figure 4 – Interaction via Extract Columns data analysis tool
Examples Workbook
Click here to download the Excel workbook with the examples described on this webpage.
References
Howell, D. C. (2010) Statistical methods for psychology (7th ed.). Wadsworth, Cengage Learning.
https://labs.la.utexas.edu/gilden/files/2016/05/Statistics-Text.pdf


I dont get it How exaacly did you count interaction?
As stated on the webpage, “Interaction is simply the product of the money and quality values.”
Charles
Hi Charles,
I was wondering if you can help me figure out how to calculate the interaction of only 2 parameters out of 8, in the case the P-value of interactions is < 0.05 please.
I found 5 parameters with p-value lower than 0.05, plus interaction also lower than 0.05, in some studies they measure interaction of A*B, A*C…
Your reply is very very important
Kindly,
Sorry, but I don’t completely understand your question.
Charles
Hi Charles,
Thank you so much for your interest.
Actually, I found after ANOVA (2-way) calculations that “interaction” has a p-value lower than 0.05 (contribution by 11 %). However, I don’t know which parameters interaction that is concerned! I have 8 parameters in my study (5 only have p-value lower than 0.05)…and how should I choose the optimum parameters in that case?
Kindly,
Hi Fathia,
I don’t know what you mean by the “optimum parameter”. In any case, if you obtain a significant result from two-way ANOVA, you can drill down to find which specific groups are significant. This is explained in
https://real-statistics.com/two-way-anova/follow-up-analyses-for-two-factor-anova/
Charles
Dear Charles,
Thank you so much for your help and support.
I will study more about Tukey HSD hopping it can be the solution to my issue.
I applied 2-way ANOVA with replications to a 3D printing process in order to optimize the print parameters. I got out of 8, 5 significant parameters plus the interaction factor having a p-value lower than 0.05
I hope you might be able to help me get my mind around the meaning of the coefficient of the interaction variable. In the example in Figure 2, I understand what the coefficients for money and quality mean (in other words their effects on VOTES), but I am just trying to come to an understanding of the interaction of money and quality. I get it when Money and Quality are number values, but it is quite elusive to me for other cases if one was using two categorical variables and their interaction. Thanks again for this great website and giving me so many approaches.
Hi Charles,
Would this still work if both the interaction variable and the variable I am interacting it with are going to take a value of either 1 or 0? Basically I am trying to assess how certain product attributes affect sales in a number of different countries and I would like to interact the 7 country indicators with each of the product attribute indicators, but obviously all of these product or country indicators will either be a 1 or 0 (as this is categorical data).
And, if so, can I just multiply each of the country indicators with each of the marketing indicators myself and run a multiple regression in excel as described here: https://real-statistics.com/multiple-regression/multiple-regression-analysis/categorical-coding-regression/ ?
Thank you!!
Tom,
You can use the interaction of two categorical variables. As you said, these will take the values 0 or 1. This is in fact commonly done.
Charles
So if my 2 columns are o and 1, I still take the product to create my interaction column? Meaning, both columns have to be equal 1 for my interaction term to be equal 1, else will be 0. Did I understand correct?
Yes, this is correct.
Charles
Hello Sir,
I need to build a third order multiple nonlinear regression models with two variable.
I wrote something like this ‘y = a0 + a1 x1 + a2 x2 + a3 x1^2 + a4 x1^3 + a5 x2^2 + a6 x2^3 + a8 x1 x2 + a9 x1 x2^2 + a10 x1^2 x2’
Is it right?
Your response is so important for me.
Have a great day.
Emily,
This looks to be correct.
Charles
I have a scenario in which I need to incorporate age into a model – where the concept of age is not so straight forward – and I’d be interested in what you think.
When the population being studied is premature infants, there are a couple ways to think about age. One is their day of life (the is straightforward – the number of days since they were born). The other is “corrected gestational age,” which is the number of days since conception.
Examples: 40 weeks after conception, an infant born prematurely at 36 weeks of pregnancy will have a day of life of 28, and a corrected gestation age of 40 weeks. A full term baby born at 40 weeks of pregnancy would have a day of life of 0 at birth, and a corrected gestational age of 40 weeks. Conversely, a two week old baby born at 30 weeks of pregnancy and a two week old full term baby have the same day of life, but different corrected gestational ages and very different biology.
Gestational age at birth (time since conception/length of pregnancy) is typically the variable that one knows and uses to convert day of life into corrected gestational age, but it is also an important variable on its own as it directly indicates how developed an infant typically is at birth.
Corrected gestational age (CGA) is meaningful because it captures developmental age. Day of life (DOL) is meaningful because it captures the amount of time out of the womb and in the world. Biologically, these are distinct factors and we want to account for both of them.
When we attempt to build a model that captures these different aspects of age and development, it seems to me we have some choices:
1) We can use DOL and CGA both as terms in the model
2) We can use DOL, CGA, and the interaction term CGA*DOL as terms in the model
3) We can use DOL, CGA, and gestational age at birth (GAB) as terms in the model
4) We can use DOL, GAB, and the interaction term DOL*GAB as terms in the model
5) We could derive another term such as CGA-DOL, or GAB+DOL, to replace GAB or CGA, respectively…
It’s tricky because these variables aren’t really independent – given any two you can compute the third – but I’m not sure that in a regression model, no information would be lost by using only two of the variables.
This question isn’t really specific to your software or to Excel. I just like the way you explain these kinds of things and you seem willing to answer questions. I would appreciate your input very much, even if it were only to point me towards additional information.
Alex,
In general, if you have two independent variables x1 and x2 and x2 can be expressed as a linear combination of x1, i.e. there are constants a and b such that x2 = b*x1 + a, then the regression model will fail due to collinearity. With three variables, collinearity can occur if there are constants a, b and c such that x3 = c*x1 + b*x2 + a, in which case the linear regression will again fail. If you don’t have this problem, then all the approaches that you have proposed should yield a regression model.
Charles
Thank you for the clear explanation.
Thanks for this very useful explanation! But what should I do on excel or minitab if I want to get a quadratic polynomial regression for something like YS = B0 + B1*H + B2*T + B3*H^2+ B4*T^2 + B5 H*T, where Bs are the coefficients, T is temperature of a hardness test, H is the hardness measured and YS is the Yield strength of a tool steel that was compressed?
See the webpage Polynomial Regression.
Charles
Why do we use natural logarithm in regression analysis
Or when is it required. Is it like to make linear the equation ?
Eshal,
Of course, we don-t always is the natural log.
A key reason for taking the log is to make the data linear.
Charles
What is y and x
Saya,
You need to look at the webpage Multiple Regression Analysis.
Charles
Hello Sir ,
I am generating the equation using 5 variables (x) in which 3 are dependent variables and 2 are independent
Which method is appropriate to develop an equation?
It really depends on what your objective is, but the simplest approach is to perform 3 regressions, one per dependent variable, each with the 2 independent variables.
Charles
In what situations do you use interaction multiple regression?
Jas,
You use in interaction when the interaction between two or more variables makes a significant contribution to the accuracy of the regression model (see the webpage https://real-statistics.com/multiple-regression/testing-significance-extra-variables-regression-model/).
You can also get more information about this at http://en.wikipedia.org/wiki/Interaction_(statistics)
Charles