The Breusch-Pagan and White tests can be carried out using Real Statistics’ Heteroskedasticity data analysis tool.
Data Analysis Tool
Real Statistics Data Analysis Tool: The Breusch-Pagan and White tests can be carried out using the Heteroskedasticity Test option of Real Statistics’ Multiple Linear Regression data analysis tool. We now show how this is done for the data in Example 1 of Breusch-Pagan Test.
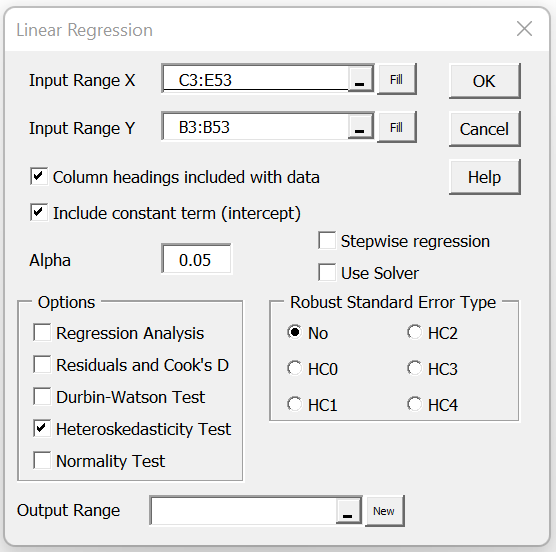
Press Ctrl-m and select Multiple Linear Regression from the Reg tab (or from the Regression dialog box if using the original user interface). Fill in the dialog box that appears as shown in Figure 1 (with references to Figure 1 of Breusch-Pagan Test).
Figure 1 – Heteroskedasticity Tests dialog box
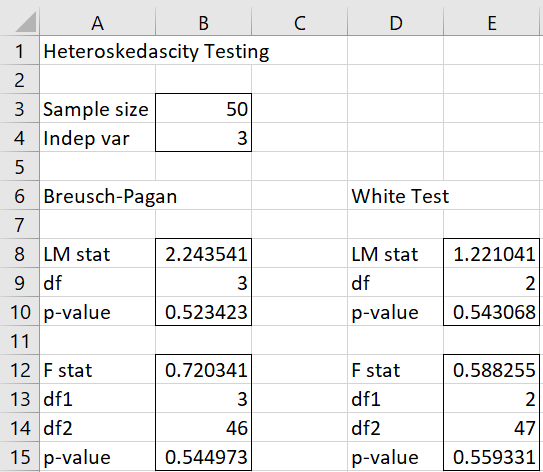
After clicking on the OK button, the output shown in Figure 2 is displayed.
Figure 2 – Heteroskedasticity Tests output
Examples Workbook
Click here to download the Excel workbook with the examples described on this webpage.
References
Wooldridge, J. M. (2013) Introductory econometrics, a modern approach (fifth edition). Cengage Learning
https://faculty.cengage.com/works/9781337558860
Williams, R. (2020) Heteroskedasticity
https://academicweb.nd.edu/~rwilliam/stats2/L25.pdf


Dear Charles,
thank you very much for your wonderful site on Real statistics! Here is possible to find real help.
May I ask you please to expand a bit the explanation how to interpret the Breusch-Pagan and White tests results. I mean the phrases:
“We see that the p-values of the two versions of the test are .52 and .54, which means there is no heteroskedasticity.”
and
“With p-value = .54 and .56, once again we get evidence that there is no heteroskedasticity.”
I mean under what conditions (limits) is it considered that heteroskedasticity is present? And how chi-square test and F-test values are compare?
As an example I add some results of my data testing:
Breusch-Pagan
LM stat 4,462624
p-value 0,034644
F stat 4,513612
p-value 0,034752
White Test
LM stat 4,54052
p-value 0,103285
F stat 2,286492
p-value 0,104066
Thanks in advance!
Hello Eugene and thanks for your kind remarks about Real Statistics.
This is a test of the null hypothesis “there is no heteroskedasticity”
If you set alpha = .05 as your significance level (the usual approach), then p-value > .05 supports the null hypothesis and p-value < .05 gives evidence that the null hypothesis is not valid. For both versions of the Breusch-Pagan, p-value = .035 < .05 gives evidence against the null hypothesis for that test For both versions of the White test, p = .10 > .05 gives evidence supporting the null hypothesis for that test.
CHarles
Hello Charles,
I was hoping you would be able to shed some light on the White Test results I received.
Is there heteroskedasticity present in the model based on the following output? I’m not quite sure how to go about interpreting the results.
I’d be grateful if you could assist me.
Thanks in advance!
White Test
LM stat 0.403834101
df 2
p-value 0.817162708
F stat 0.182207061
df1 2
df2 24
p-value 0.834570885
Pran,
AS explained on the following webpage, p-value = .8 provides evidence that there is no heteroskedasticity.
https://www.real-statistics.com/multiple-regression/heteroskedasticity/white-test-for-heteroskedasticity/
Charles
Hello Charles,
Thanks for making your amazing work available online. It has helped me immensely in bridging gaps in my understanding.
Does the Real-Statistics Pack has a corresponding function for Full-White test as given in one of your practice workbooks? Presently, the White-Test function gives t stat for the Shortened-White Test.
Shortened-White Test – (Real-Statistics-Examples-Regression-1 (Sheet : Heter 3))
Full White Test – (Real-Statistics-Examples-Regression-1 (Sheet : Heter 4))
Rahul,
Currently, I only provide the shortened White test. I will look into adding the full test.
Charles