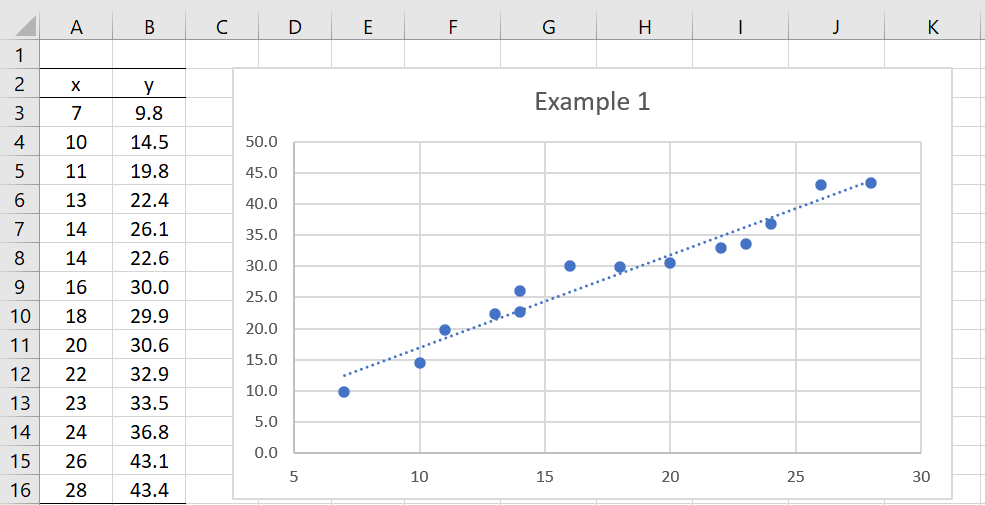
In the regression shown in Figure 1, we see that the data points are fairly uniformly distant from the regression line, indicating that the residuals are evenly dispersed.
Figure 1 – Homoskedasticity
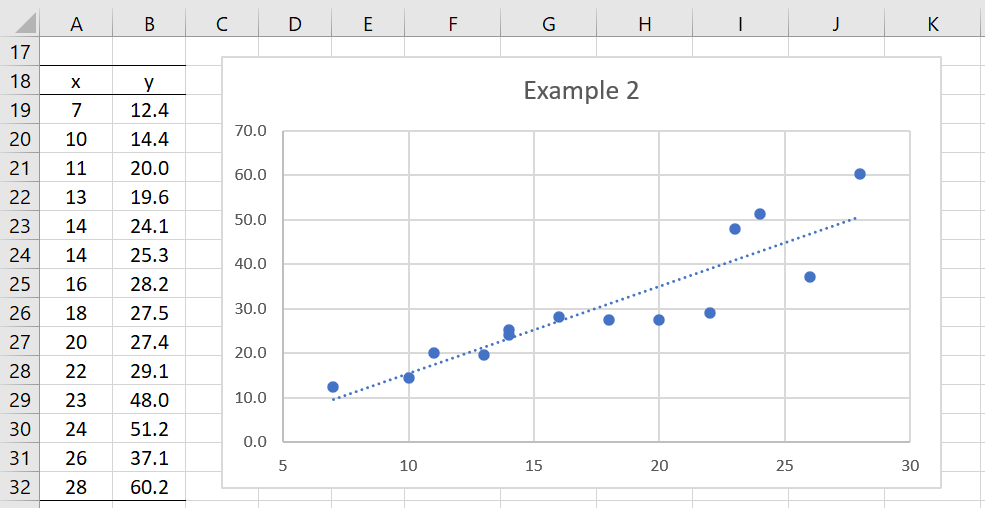
On the other hand, the points on the right side of the regression shown in Figure 2 seem to be farther from the regression line than those on the left. This is indicative of potential heteroskedasticity, although it is not clear whether this sort of difference is sufficient to say that the data is heteroskedastic.
Figure 2 – Heteroskedasticity?
In Breusch-Pagan Test and White Test, we describe two tests that can be used to clarify the situation.
Examples Workbook
Click here to download the Excel workbook with the examples described on this webpage.
References
Wooldridge, J. M. (2013) Introductory econometrics, a modern approach (fifth edition). Cengage Learning
https://faculty.cengage.com/works/9781337558860
Williams, R. (2020) Heteroskedasticity
https://academicweb.nd.edu/~rwilliam/stats2/L25.pdf
Statistical (2024) Introduction to heteroscedasticity
https://timeseriesreasoning.com/contents/introduction-to-heteroscedasticity

