Basic Concepts
Suppose we have a sample {(Xi, yi): i = 1, …, n} of size n with k independent variables. We perform OLS regression based on this data and find the residuals ri based on the regression model. Next, perform OLS regression using the data {(Xi, ri2): i = 1, …, n} to find the coefficient of determination R2.
We test the null hypothesis that the original data is homoskedastic using the following test
Here, LM stands for the Lagrange Multiplier.
This test can only be used when your data is normally distributed; i.e. the residuals are normally distributed.
Essentially this test is testing whether the regression coefficients for all the independent variables are equal to zero. Thus, we can also use an F test comparing this second regression with the regression of the squared residuals only on the constant term. This is equivalent to the test
Example
Example 1: Conduct the Breusch-Pagan test for the data in Example 2 of Multiple Regression Analysis using Excel.
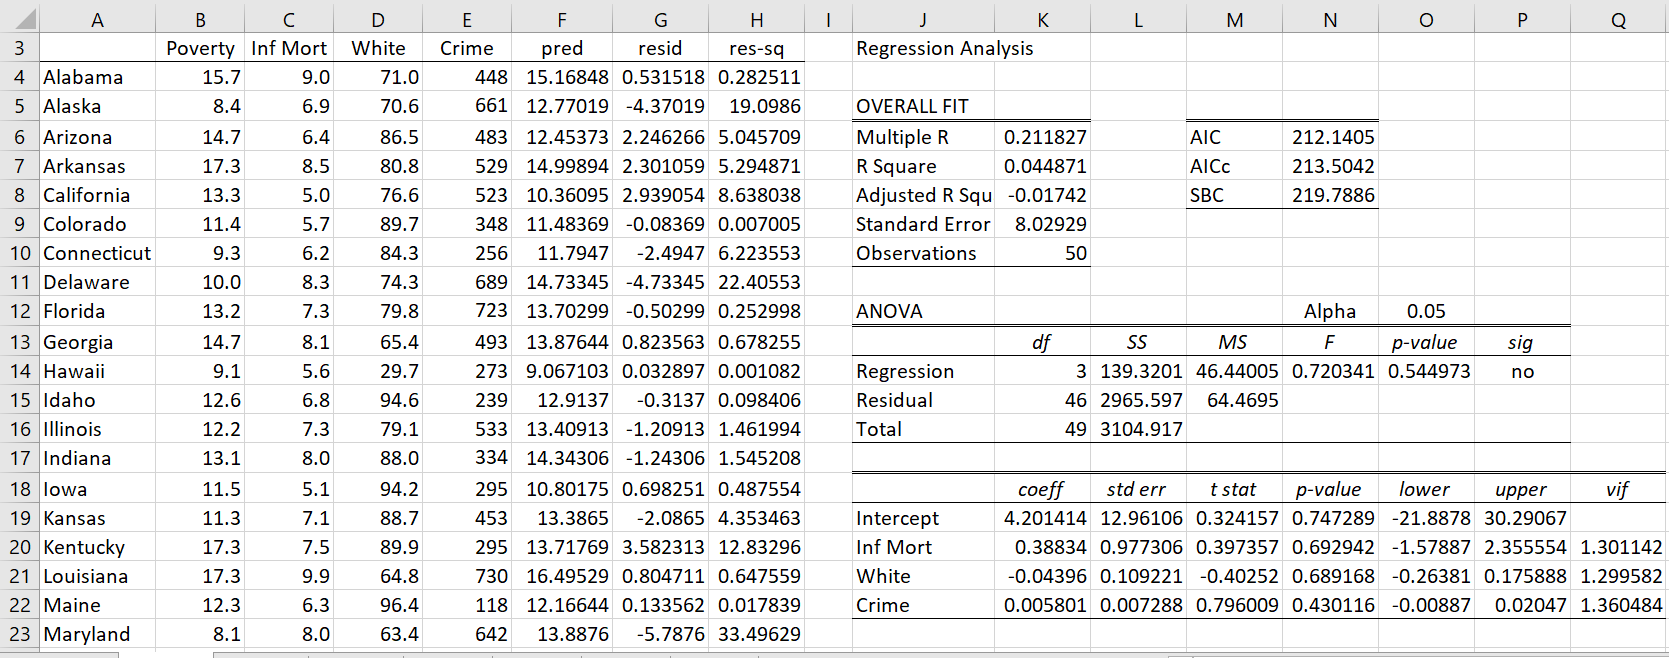
The data for the first 20 (of 50) states are shown in columns A through E of Figure 1.
Figure 1 – Breusch-Pagan Test (part 1)
Column F contains the predicted Poverty values for each state based on the linear regression of the Infant Mortality, White and Crime variables on Poverty. Here, range F4:F53 contains the array formula =TREND(B4:B53,C4:E53). Column G contains the residuals (i.e. the ri values); e.g. cell G4 contains the formula =B4-F4. Column H contains the squared residual values: e.g. cell H4 contains the formula =G4^2.
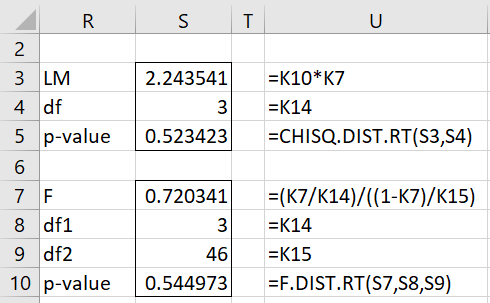
We now create the linear regression model with Infant Mortality, White and Crime as the independent variables and the squared residuals from column H as the dependent variable. The results are shown on the right side of Figure 1. We now use the results from this regression to conduct the Breusch-Pagan Test as shown in Figure 2.
Figure 2 – Breusch-Pagan Test (part 2)
We see that the p-values of the two versions of the test are .52 and .54, which means there is no heteroskedasticity.
Worksheet Functions
Real Statistics Functions: The following Real Statistics functions automate the Breusch-Pagan test in Excel.
BPagStat(R1, R2, chi) = Breusch-Pagan statistic for the X values in R1 and Y values in R2; if chi = TRUE (default) then the LM statistic is returned; otherwise the F statistic is returned.
BPagTest(R1, R2, chi) = p-value of the Breusch-Pagan test for the X values in R1 and Y values in R2; if chi = TRUE (default) then the chi-square test is used; otherwise the F test is used.
The values in Figure 1 can be achieved by placing the formulas
=BPagStat(C4:E53,B4:B53) in cell S3
=BPagTest(C4:E53,B4:B53) in cell S5
=BPagStat(C4:E53,B4:B53,FALSE) in S7
=BPagTest(C4:E53,B4:B53,FALSE) in S10
Examples Workbook
Click here to download the Excel workbook with the examples described on this webpage.
References
Wooldridge, J. M. (2013) Introductory econometrics, a modern approach (fifth edition). Cengage Learning
https://faculty.cengage.com/works/9781337558860
Williams, R. (2020) Heteroskedasticity
https://academicweb.nd.edu/~rwilliam/stats2/L25.pdf
Statistical (2024) Introduction to heteroscedasticity
https://timeseriesreasoning.com/contents/introduction-to-heteroscedasticity


