Objective
We describe the Newey-West method for calculating standard errors when there is autocorrelation.
OLS Approach
In OLS regression, the regression coefficients are computed using
and the covariance matrix of B is
where σ2 is the common variance of the residuals εi, as estimated by MSE. This is equivalent to using
where
This can be estimated using the covariance matrix of the residuals, which is a diagonal matrix whose diagonal consists of the values n/(n-k)·σ2. This is true since E[e] = 0 and E[eeT] = 0. Equivalently,
where R is the column vector consisting of values.
This same approach is used in Huber-White’s Robust Standard Errors method where there isn’t homogeneity of variances, except that S is calculated in a different way.
Newey-West Approach
The Newey-West method also uses this approach, except that XTSX is calculated in yet another way. The standard errors that result are called Heteroskedasticity and Autocorrelation Corrected (HAC) standard errors.
When there is autocorrelation with lags up to h > 0, we use the following value
where Xi is the ith row in the design matrix X. The first sum in the formula is the value of XTSX when there is no autocorrelation (i.e. h = 0).
The Newey-West method handles autocorrelation with lags up to h, and so it is assumed that lags larger than h can be ignored. Note too that Newey-West not only corrects for autocorrelation it also corrects for heteroscedasticity (heterogeneity of variances).
We now define
Ri as the n-i × 1 column vector whose values are e1ei+1, e2ei+2, …, en-ien
Ui as the n-i × k matrix consisting of the first n-i rows in X
Vi as the n-i × k matrix consisting of the last n-i rows in X
Wi is the k × k matrix
for i >0, and
Thus
Example
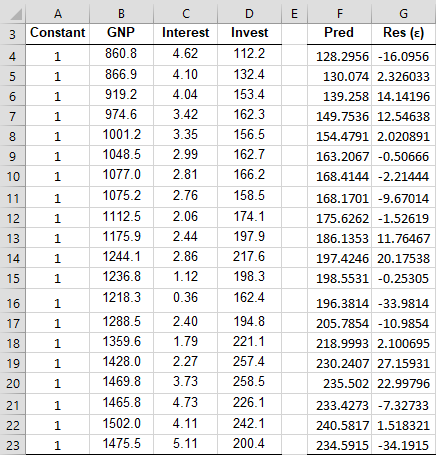
Example 1: Calculate the HAC standard errors for Example 1 of Breusch-Godfrey Test for order h = 3. We repeat the data elements in columns B, C and D of Figure 1. We also add a column of ones in column A so that range A4:C23 is the design matrix.
To start, we first calculate the residuals (column G of Figure 1) as in Figure 3 of Breusch-Godfrey Test.
Figure 1 – Finding HAC standard errors (part 1)
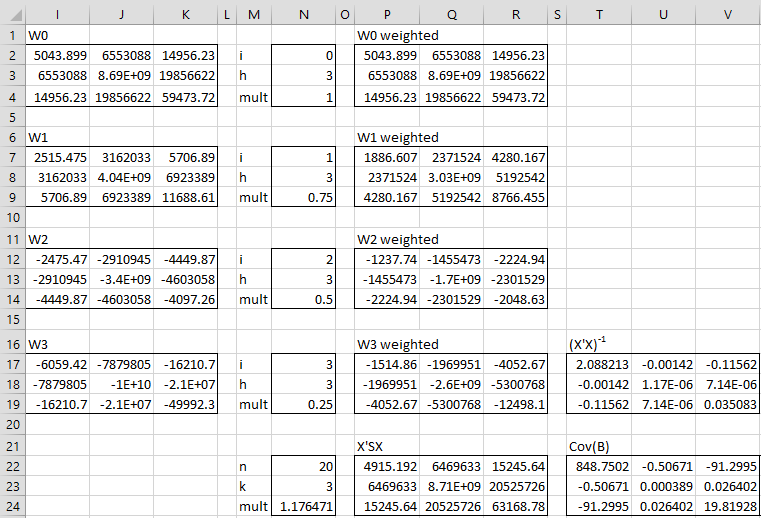
The calculations continue as shown in Figure 2.
Figure 2 – Finding HAC standard errors (part 2)
Wi calculations
Matrix W0 (range I2:K4) is calculated by the array formula
=MMULT(TRANSPOSE(A4:C23),A4:C23*G4:G23^2)
Matrix W1 (range I7:K9) is calculated by the array formula
=MMULT(TRANSPOSE(A4:C22),A5:C23*G4:G22*G5:G23) + MMULT(TRANSPOSE(A5:C23),A4:C22*G4:G22*G5:G23)
Matrix W2 (range I12:K14) is calculated by the array formula
=MMULT(TRANSPOSE(A4:C21),A6:C23*G4:G21*G6:G23) + MMULT(TRANSPOSE(A6:C23),A4:C21*G4:G21*G6:G23)
The calculation of W3 is similar. Each of the matrices W0, W1, W2, W3, is multiplied by the value 1 – i/(h+1) (the values in cells N4, N9, N14, N19 to obtain the weighted versions of W0, W1, W2, W3. The value of XTSX is then calculated to be n/(n-k) times the sum of the weighted versions of the Wj as shown in range P22:R24, using the formula =N24*(P2:R4+P7:R9+P12:R14+P17:R19).
Covariance matrix
The covariance matrix for the coefficient matrix B (range T22:V24) is now calculated by
=MPROD(T17:V19,P22:R24,T17:V19)
where T17:V19 contains (XTX)-1, as calculated by =CORE(B4,C23).
Recall that the worksheet formula =MPROD(R1, R2, R3) is equivalent to =MMULT(R1,MMULT(R2,R3)) and the formula =CORE(R1) is equivalent to =MINVERSE(MMULT(TRANSPOSE(R1),R1)).
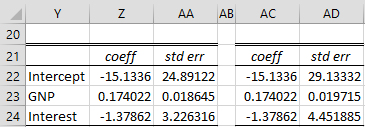
The HAC standard errors are equal to the square roots of the items on the diagonal of the covariance matrix of B, as shown in range AD22:AD24 of Figure 3 using the array formula =SQRT(DIAG(T22:V24)).
Figure 3 – Comparing OLS and HAC standard errors
Range AA22:AA24 contains the standard errors calculated by OLS. Note that the HAC standard errors are larger than the OLS standard errors.
The OLS coefficients and standard errors can be calculated by the Real Statistics array formula =RegCoeff(B4:C23,D4:D23) or via the Multiple Linear Regression data analysis tool. The HAC coefficients (range AC22:AC24) are identical to the OLS coefficients. The HAC coefficients and standard errors can be calculated by the Real Statistics array formula =HACCoeff(B4:C23,D4:D23, 3), described as follows.
Worksheet Function
Real Statistics Function: The following array function is available in the Real Statistics Resource Pack where R1 is an n × k array with X data elements and R2 is an n × 1 array with Y data elements and lags is the specified number of lags.
HACCoeff(R1, R2, lags): returns a k+1 × 2 array whose first column contains the OLS regression coefficients and whose second column contains the corresponding HAC standard errors.
Data Analysis Tool
See Breusch-Godfrey and Newey-West Tool for information about how to calculate the Newey-West standard errors using the Real Statistics Breusch-Godfrey and Newey-West data analysis tool.
Examples Workbook
Click here to download the Excel workbook with the examples described on this webpage.
References
STATA (2018) Regression with Newey–West standard errors
https://www.stata.com/manuals13/tsnewey.pdf
Ao, X. (2009) Heteroskedasticity and autocorrelation consistent standard errors
https://www.hbs.edu/research-computing-services/Shared%20Documents/Training/hac.pdf
Wooldridge, J. M. (2013) Introductory econometrics, a modern approach (fifth edition). Cengage Learning
https://faculty.cengage.com/works/9781337558860


