One-way ANOVA
In Normality of ANOVA Residuals we explain that for one-way ANOVA, the residuals are the difference between the actual data elements and their group mean. We now show this to be so for Example 1 from Normality of ANOVA Residuals using the regression coding described in ANOVA using Regression.
We repeat the data from this example on the left side of Figure 1.
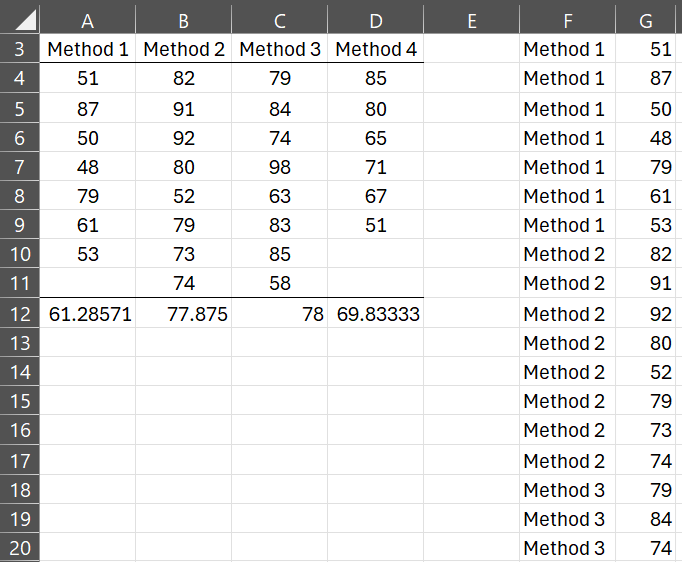
Figure 1 – One-way ANOVA data
Range F3:G31 on the right side of the figure is the equivalent data in stacked format via the formula =Anova1Std(A4:D11). The last 11 rows are not displayed.
We now reformat the data into an equivalent regression model in range I2:L31 of Figure 2 by using the following dummy variables (once again the last 11 rows are not displayed):
- t1 = 1 if Method 1 and = 0 otherwise
- t2 = 1 if Method 2 and = 0 otherwise
- t3 = 1 if Method 3 and = 0 otherwise
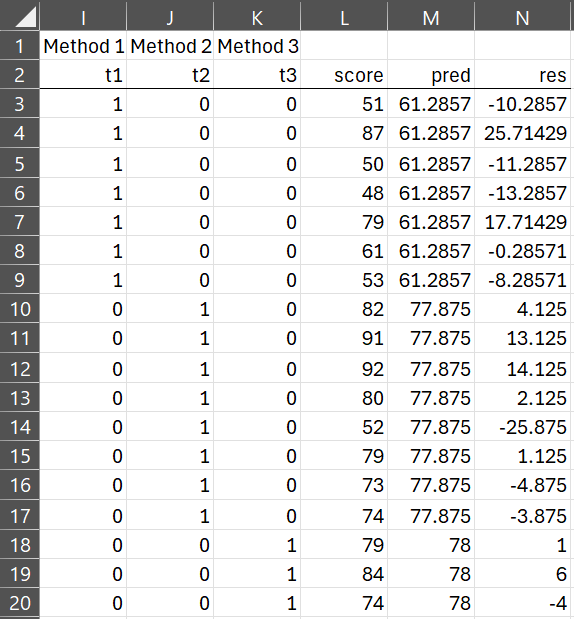
Figure 2 – Regression coding of the data from Figure 1
We create the first three columns in Figure 2 by placing the formula =IF($F3=I$1,1,0) in cell I3, highlighting range I3:K31 and pressing Ctrl-R and Ctrl-D. We next place =G3 in cell L3, highlight range L3:L31, and press Ctrl-D to obtain the vales in the fourth column.
Using Multiple Regression
To create the next two columns we first use the Multiple Regression data analysis tool using the X data in I2:K31 and Y data in L2:L31 to obtain the results shown in Figure 3.
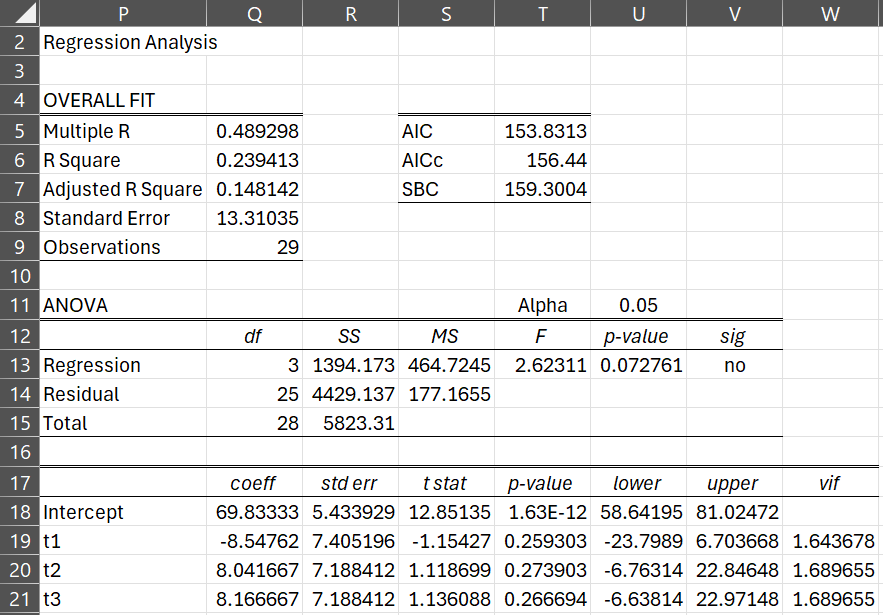
Figure 3 – Regression
Finally, we place the formula =Q18+MMULT(I3:K31,Q19:Q21) in cell M3 of Figure 2 and =L3-M3 in cell N3, highlight range M3:N31, and press Ctrl-D. This fills column N with the same residuals we obtained in Figure 2 of Normality of ANOVA Residuals. Note that column M contains a block of the mean of the data values in Method 1 (cell A12), followed by blocks of the mean of the data values in Method 2 and then the mean of the data values in Method 3, and finally the mean of the data values in Method 4.
Two-way ANOVA
In Normality Testing of Factorial ANOVA Residuals we explain that for two-way ANOVA, the residuals are the difference between the actual data elements and the corresponding interaction mean. We now show this to be so for Example 1 from Normality Testing of Factorial ANOVA Residuals.
We repeat the data from this example on the left side of Figure 4.
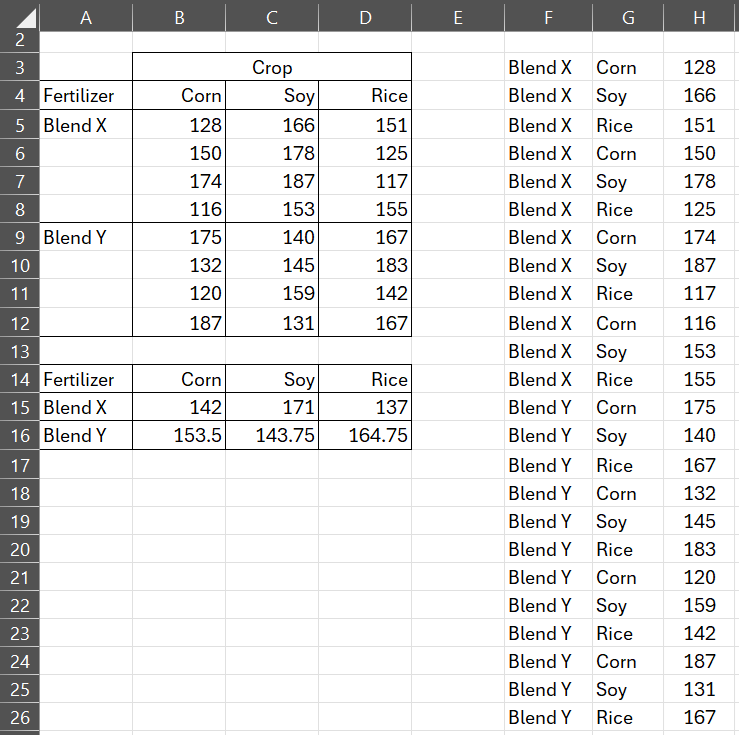
Figure 4 – Two-way ANOVA data
Range F3:H26 on the right side of the figure is the equivalent data in stacked format via the formula =Anova1Std(A4:D12).
We now reformat the data into an equivalent regression model in range I2:L31 of Figure 5 by using the following dummy variables:
- t1 = 1 if Blend X and = 0 otherwise
- t2 = 1 if Corn and = 0 otherwise
- t3 = 1 if Soy and = 0 otherwise
We now use these dummy variables to set up the regression model in range J2:O26 in Figure 5 in the same manner as was done to create the regression model in Figure 2. The interactions in columns M and N are created by inserting the formula =$J3*K3 in cell M3, highlighting the range M3:N26, and pressing Ctrl-R and Ctrl-D.
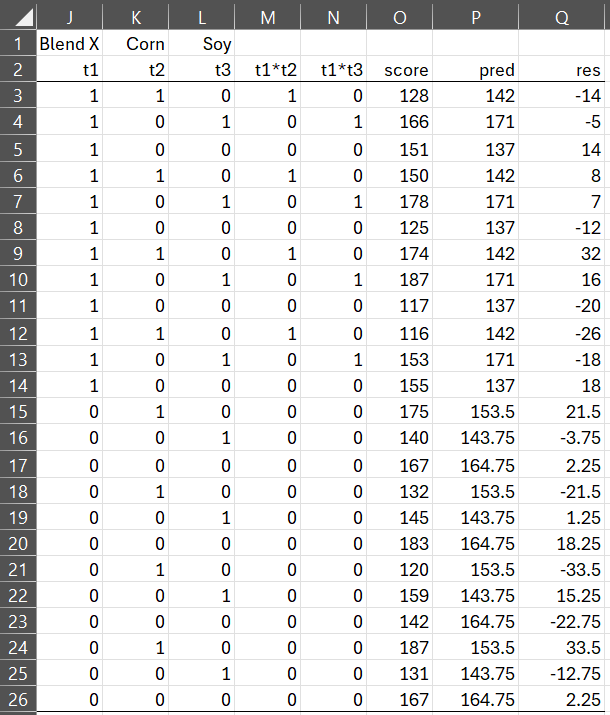
Figure 5 – Regression version of the data from Figure 4
Using Multiple Regression
To create the last two columns we first use the Multiple Regression data analysis tool using the X data in J2:N26 and Y data in O2:O26 to obtain the results shown in Figure 6.
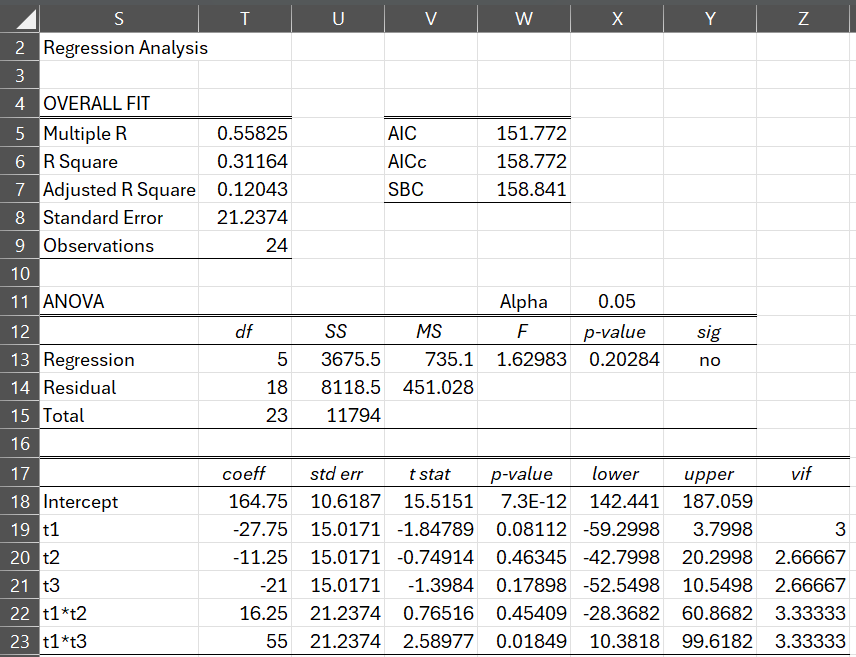
Figure 6 – Regression
Finally, we place the formula =T18+MMULT(J3:N26,T19:Q23) in cell P3 of Figure 5 and =O3-P3 in cell Q3, highlight range P3:Q26, and press Ctrl-D. This fills column N with the same residuals we obtained in Figure 1 of Normality Testing of Factorial ANOVA Residuals. Note that column P contains the mean values in range B15:D16 of Figure 4.
Examples Workbook
Click here to download the Excel workbook with the examples described on this webpage.
References
GraphPad (2024) Residuals tab: One-way ANOVA
https://www.graphpad.com/guides/prism/latest/statistics/stat_1wayanova_residuals-tab.htm
Minitab (2024) Does the response need to follow a normal distribution?
https://support.minitab.com/en-us/minitab/help-and-how-to/statistical-modeling/anova/supporting-topics/anova-models/does-the-response-need-to-be-normal/#:~:text=ANOVA%20assumes%20that%20the%20residuals,assumptions%20of%20ANOVA%20are%20met.
Trochim, W. (2024) Dummy variables
https://conjointly.com/kb/dummy-variables/