Objective
On this webpage, we describe Real Statistics’ data analysis tool for two within-subjects factors repeated measures using multivariate techniques. We begin with an example in which each of the factors has 3 levels.
3 × 3 Example
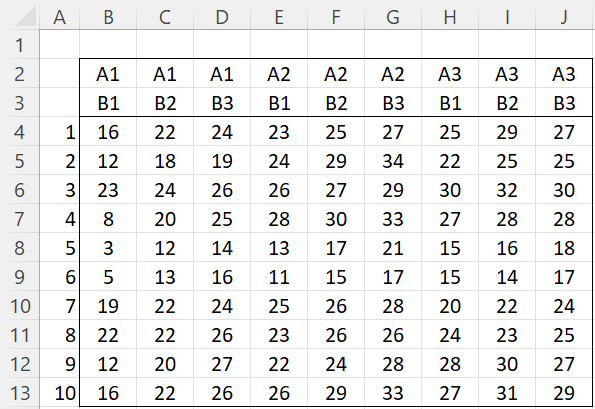
Example 1: Perform repeated measures analysis for the data in Figure 1 based on treatments A1, A2, and A3 measured over three time periods B1, B2, and B3.
Figure 1 – 3 × 3 within-subjects repeated measures data
Transformations
Both the A and B factors have 3 levels. Thus, the transformation matrix C is as shown on the left side of Figure 2.
In general, when a factor, say factor B, has m levels, B1, B2, …, Bm, matrix C will have n–1 rows for this factor. The first of these rows will contain –(m–1) for level B1 and +1 for the other levels. The second of these rows will contain 0’s for level B1, –(m–2) for level B2, and +1 for the other levels. The jth of these rows will contain 0’s for levels B1 through B(j–1), –(m–j) for level Bj, and +1 for the other levels.
Figure 2 – Repeated measures transformation
This time, A×B requires 2×2 = 4 rows in matrix C. We obtain the first two rows by inserting the formula M$4*M6 in cell M8, highlighting range M8:U9, and then pressing Ctrl-R and Ctrl-D. The last two rows are obtained by inserting the formula M$5*M7 in cell M10, highlighting range M10:U11, and then pressing Ctrl-R and Ctrl-D.
We obtain the right side of the figure via the array formula =MMULT(B4:J13, TRANSPOSE(M4:U11)).
Analysis
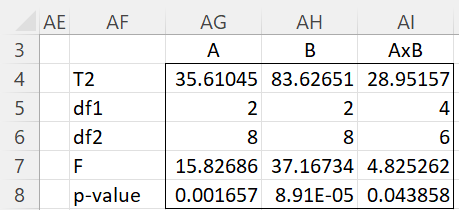
We then obtain the Hotelling’s T-square analyses, in the usual manner (see Two Multivariate Within-Subjects Factors), as shown in Figure 3.
Figure 3 – Repeated measures analyses
Worksheet Function
Real Statistics Function: The Real Statistics Resource Pack contains the following array function:
RepMeasTransform(a,b) = a ab × ab–1 array representing the transformation matrix in the case where there are two within-subjects factors A, with a levels, and B, with b levels.
E.g. the values in range M4:U11 in Figure 2 can be obtained by the array formula =RepMeasTransform(3,3).
Data Analysis Tool
Real Statistics Data Analysis Tool: The Repeated Measures Manova (2W+0B) data analysis tool can be used to perform the repeated measures tests described above.
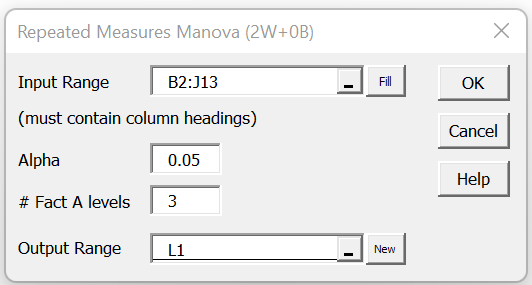
For Example 1, press Ctrl-m and choose the Repeated Measures Manova (2W+0B) option from the MultiVar tab (or from the Manova option if using the original user interface). Now fill in the fields in the dialog box that appears as shown in Figure 4 and click on the OK button.
Figure 4 – Repeated Measures Manova (2W+0B) dialog box
The output is similar to that shown in Figures 2 and 3.
Examples Workbook
Click here to download the Excel workbook with the examples described on this webpage.
References
Rencher, A.C. (2002) Methods of multivariate analysis (2nd Ed). Wiley-Interscience, New York.
http://math.bme.hu/~csicsman/oktatas/statprog/gyak/SAS/eng/Statistics%20eBook%20-%20Methods%20of%20Multivariate%20Analysis%20-%202nd%20Ed%20Wiley%202002%20-%20(By%20Laxxuss).pdf


