Two-way contingency tables
We now define an algorithm that lets us compare two-way tables which have different row and/or column totals. We explain the algorithm using the following example.
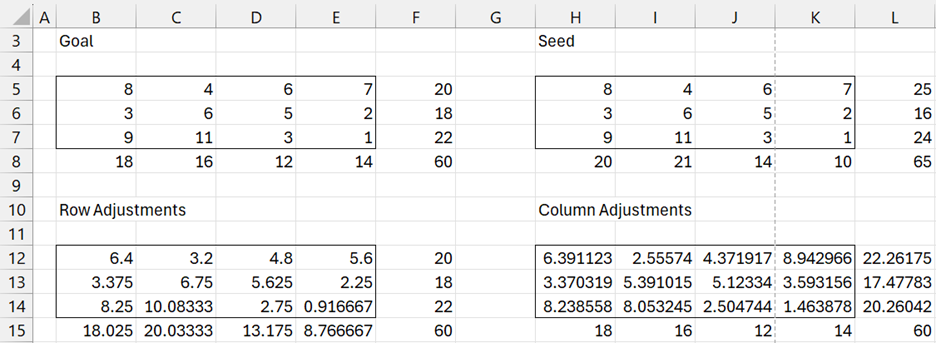
Example 1: Revise the table in range A5:D7 of the following figure so that the sum of each of the rows is the indicated row total and the sum of each of the columns is the indicated column total.
Figure 1 – Start of iterative proportional fitting procedure
In Figure 1 the range B5:E7 contains the initial table values. The range F5:F7 contains the target row totals and the range B8:E8 contains the target column totals.
In order for the procedure to work the sum of the target row totals must equal the sum of the target column totals. This is indeed the case for Example 1. The grand total (cell F8) contains the value 60, which is the sum of the target row totals as well as the target column totals; i.e. SUM(F5:F7) = SUM(B8:E8) = 60. We also assume that all table entries, as well as target row/column totals, are positive.
Procedure explained
We begin the procedure (step 0) by putting the initial table values in the range H5:K7, but this time we include the real row and column totals (this is called the Seed in Figure 1).
Step 1 of the procedure consists of two parts. In the first part, the values in the table are adjusted proportionally so that the row totals equal the targeted values (Row Adjustment). E.g. the formula in cell B12 is =H5*F5/L5.
In the second part, the values in the table are adjusted proportionally so that the column totals equal the targeted values (Column Adjustment). E.g. the formula in cell H12 is =B12*B8/B15.
This same procedure is now repeated again and again until the sum and column totals are sufficiently close to the target values. For Example 1 this is achieved in 8 steps, as can be seen in Figure 2. In fact, after 8 steps the row and column totals are exactly equal to the target values and so any further iterations will produce exactly the same table values.
Figure 2 – Iterative proportional fitting procedure for Example 1
The final result of the procedure is found in the lower right-hand corner of Figure 2.
Independence Testing
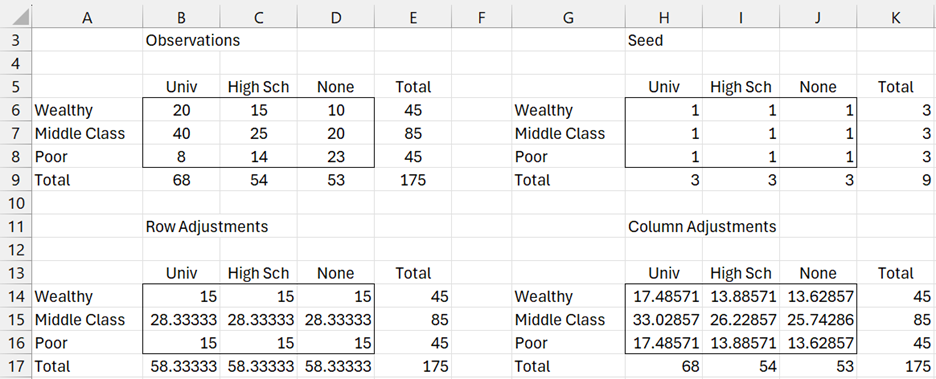
Example 2: Use the iterative proportional fitting procedure to find the expected values for the data in Example 1 of Independence Testing assuming that a person’s level of schooling is independent of their parents’ wealth.
It turns out that if the row and column totals of the observed data are used as the targets and 1’s are used as the seed, the IPF procedure converges in 1 step to the expected values. This is depicted in the following figure.
Figure 3 – Iterative proportional fitting procedure for Example 2
These results agree with those found in Figure 1 of Independence Testing.
Three-way contingency tables
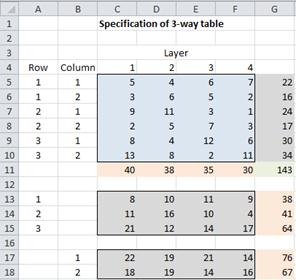
We now turn our attention to three-way tables. The procedure is similar. The main challenge is how to represent a three-dimensional table in two-dimensional space. We will use the representation shown in Figure 4.
Figure 4 – Three-way contingency table
Figure 4 contains a 3 × 2 × 4 table; i.e. 3 rows, 2 columns and 4 layers (we use the term layer for the third dimension). The area in blue (range C5:F10) contains the data for the table.
The areas in grey contain the marginal totals for any two dimensions: G5:G10 contains the totals for Rows × Columns, C13:F15 contains the totals for Rows × Layers and C17:F18 contains the totals for Columns × Layers. Thus, for example, cell E14 contains the total for the 2nd row and 3rd layer, and so has the value 10. It can be calculated in Excel using the formula SUMIF(A5:A10,A14,E5:E10).
The areas in pink contain the marginal totals for any single dimension: C11:F11 contains the totals for the layers, G13:G15 contains the totals for the rows and G17:G18 contains the totals for the columns. E.g. F11 contains the totals for the 4th layer and can be calculated via the formula SUM(F5:F10). Similarly, G14 contains the totals for the 2nd row and can be calculated via the formula SUM(C14:F14).
Finally, cell G11 (shaded in green) contains the grand total, i.e. the sum of all the values in the table. This can be specified in Excel using any one of the following formulas: SUM(C5:F10), SUM(G5:G10) or SUM(C11:F11).
Observations
With two-way tables, the only restriction on the target row and column totals is that the sum of the target row totals must equal the sum of the target column totals. The situation is more complicated with three-way totals. For these reasons, we will only consider targets that already come from a three-way table. This is not a real limitation since this is the only case we care about anyway. Once again we will demonstrate the key concepts by means of an example.
Example
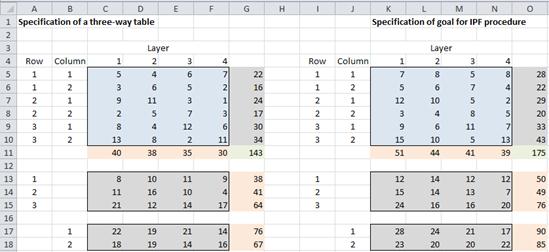
Example 3: Revise the 3-way table in Figure 4 (repeated on the left side of Figure 5) so that its row, column and layer totals are as described in the 3-way table on the right side of Figure 5.
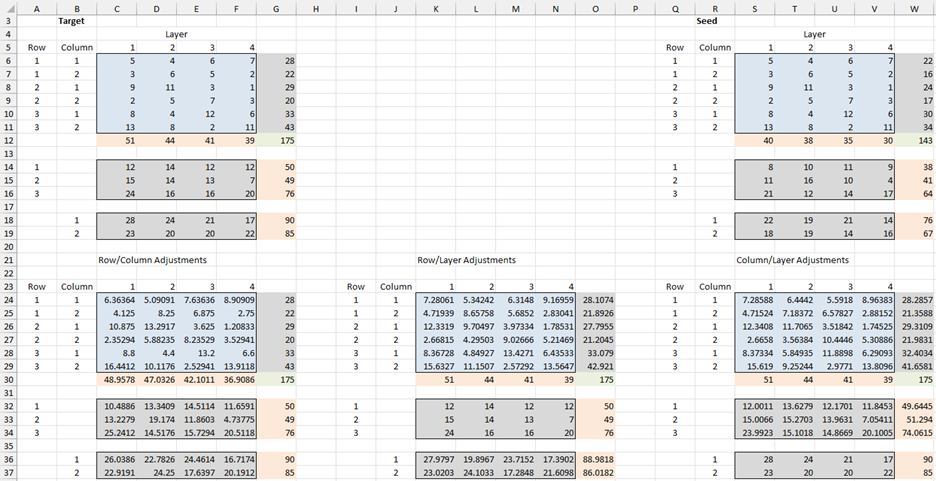
Figure 5 – Specification of target marginal totals
Essentially we are attempting to insert the data from the table on the left into the table on the right while retaining all the totals for the table on the right. We now show the IPF procedure for accomplishing this (see Figure 6).
Figure 6 – Steps 0 and 1 of IPF procedure for Example 3
Step 1 of the procedure consists of three parts. In the first part, the values in the table are adjusted proportionally so that the row × column totals meet the targeted values (Row/Column Adjustment). E.g. the formula in cell F25 is =V7*G7/W7.
In the second part the values in the table are adjusted proportionally so that the row × layer totals meet the targeted values (Row/Layer Adjustment). E.g. the formula in cell L28 is =D28*D16/D34.
In the third part the values in the table are adjusted proportionally so that the column × layer totals meet the targeted values (Column/Layer Adjustment). E.g. the formula in cell U29 is =M29*E19/M37.
This same procedure is now repeated again and again until all the marginal totals are sufficiently close to the target values. After 19 iterations we arrive at the solution shown in Figure 7.
Figure 7 – Solution to Example 3
Worksheet Functions
Real Statistics Functions: The Real Statistics Resource Pack supplies the following array functions for implementing the IPF procedures.
IPFP2(R1): outputs the results of the IPFP algorithm for two-way contingency tables. R1 contains the input data and the target row and column totals, formatted as in range A5:E8 of Figure 1. If R1 is an m+1 × n+1 range then the output is an m × n range.
IPFP3(R1, R2): outputs the results of the IPFP algorithm for three-way contingency tables. R1 contains the input data, formatted as in range A5:F10 of Figure 5. R2 contains the targets, formatted as in range K5:N10 of that figure. The format of the output is the same as that of range R1.
For Example 1, the output from the formula =IPFP2(B5:F8) is shown in range H5:K7 of Figure 8.
Figure 8 – IPFP2 function
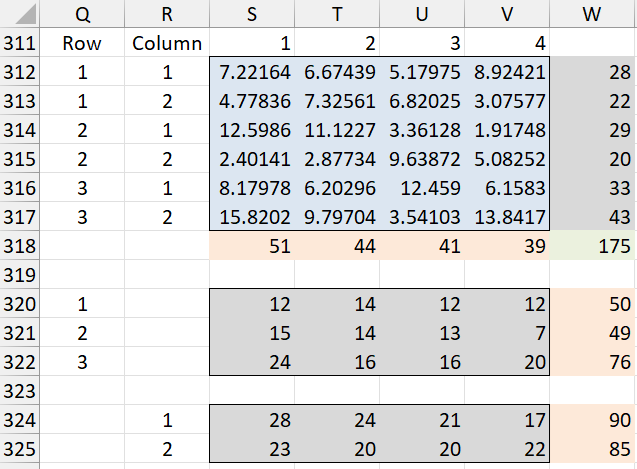
For Example 3, the output from the formula =IPFP3(A5:F10, K5:N10) is shown in range R5:W10 of Figure 9. None of the totals are included in the input or output ranges.
Figure 9 – IPFP3 function
Examples Workbook
Click here to download the Excel workbook with the examples described on this webpage.
References
Wikipedia (2012) Iterative proportional fitting
https://en.wikipedia.org/wiki/Iterative_proportional_fitting
Howell, D. C. (2010) Statistical methods for psychology (7th ed.). Wadsworth, Cengage Learning.
https://labs.la.utexas.edu/gilden/files/2016/05/Statistics-Text.pdf
Hunsinger, E. (2008) Iterative proportional fitting for a three-dimensional table
https://edyhsgr.github.io/IPFDescription/AKDOLWDIPFTHREED.pdf



For a 2 by 2 contigency table,how do you find a minimal sufficient statistics using iterative proportional fitting and using the estimates to fit a log linear models?
Sorry, but I don’t understand your question. Perhaps the following webpage would be helpful:
https://www.real-statistics.com/summary-of-models-two-way-contingency-tables/
Charles
Hi Charles, thanks a lot for sharing this. What I do not understand well is, should I passing the output, e.g. in T5 = 7.19 to all those households/ ids , as a wight ?
Sorry, but I don’t understand your question.
Charles
Is IPFP2 compatible with VBA
Hello Thomas,
IPFP2 is written in VBA and you can call it from VBA as described at
Calling Functions from VBA
Charles
I don’t understand how to get cell (K36) in the row/layer adjustment
Duha,
The formula in that cell is =SUMIF(J24:J29,J36,K24:K29)
Charles
how about a generalized IPFP for N-dimensional contingency tables where N>3
George,
I haven’t implemented this on the Real Statistics website or software as of yet. Keep in mind that the situation is already pretty complicated for 3 dimensions. It might be difficult to interpret results beyond 3 dimensions.
Charles
Hi,
Is there any way to get rid of decimals? I would like to get an output with integers and still have totals to match.
Thank you.
I don’t know of any elegant way of doing this. You could always try rounding off all the decimals to integers and then tweaking the results so that the totals come out right.
Charles
Although a lot of time passed … this may be solved (at least for the two-way case by algorithms for biproportional apportionment for electoral systems, cf.
https://www.math.uni-augsburg.de/htdocs/emeriti/pukelsheim/bazi/
and
https://www.th-rosenheim.de/wirtschaft/wirtschaftsmathematik-aktuarwissenschaften-bachelor/labor-fuer-angewandte-mathematik-und-statistik/
Alternatively, round down and start with the highest remainder until all totals are met.
Hello Sebastian,
Thanks for sharing this.
Charles
Hi,
I’ve just downloaded Real Statistics Resource Pack, but, it doesn’t include Iterative Proportional Fitting Procedure. I thought it would be a part of it.
Viktoria
Sorry Viktoria, but the software doesn’t include the IPFP yet. You can download the Examples Workbook file to get an Excel version of the example on the referenced webpage.
Charles
Hi,
I am unable to find IPFP in the Real Statistics Resource Pack. Can you please help point me to it?
Thanks,
Joan
Joan,
It is not one of the data analysis tools. You need to enter the array formula =IPFP2(R1) or =IPFP3(R1) and press Ctrl-Shft-Enter where R1 is the range containing your data in the format described on this webpage.
Charles
h