Functions
A function is a mapping between two sets, called the domain and the range, where for every value in the domain there is a unique value in the range assigned by the function. Generally, functions are defined by some formula; for example f(x) = x2 is the function that maps values of x into their square. The mapping is between all numbers (the domain) and non-negative numbers (the range).
Polynomials
A function is polynomial if it has the form
for some non-negative integer n (called the degree of the polynomial) and some constants a0, a1, …, an where an ≠ 0 (unless n = 0). The function is linear if n = 1 and quadratic if n = 2.
Limits
We often use limit notation such as
as a shorthand for as x gets larger the value of the function f(x) approaches the value a. Some examples for various values of f(x) are as follows:
We can also evaluate the limit of a function when x approaches some other value. For example, in the following example as x gets close to 0 the value of the function approaches 1.
We can also use the limit notation with series. If xn = 1 – 1/n where n is a positive integer then
since the series ,
,
,
, … converges to 1.
Graphs
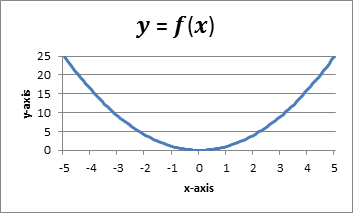
Often we use a graph to show the relationship between x and f(x). A graph consists of all the points (x,y) in what is called the xy plane where x is in the domain of f and y = f(x). The graph is drawn in a rectangular grid defined by the x-axis (drawn horizontally) and the y-axis (drawn vertically) meeting at a point (0, 0) call the origin. In particular, the graph of y = f(x) for f(x) = x2 is given in Figure 1.
Figure 1 – Graph of y = f(x) where f(x) = x2
A line is a set of points (x, y) such that y = bx + a for some constants a and b. b is called the slope of the line and a is called the y-intercept.
References
Libretexts Mathematics (2026) Graphs of polynomial functions
https://math.libretexts.org/Bookshelves/Precalculus/Precalculus_1e_(OpenStax)/03%3A_Polynomial_and_Rational_Functions/3.04%3A_Graphs_of_Polynomial_Functions
Libretexts Mathematics (2026) The limit of a function
https://math.libretexts.org/Bookshelves/Calculus/Calculus_(OpenStax)/02%3A_Limits/2.02%3A_The_Limit_of_a_Function

Thank you so much, I have just spent a half hour trying to find a lay-person information on the statistics. I am taking an advance course and I am sinking fast. Your website is fabulous, if I get really upset I look at that great scenic picture. Thanks again!
Nichole,
Glad I could help.
Charles