Worksheet Functions
Real Statistics Functions: The following are array functions where R1 contains data in either raw or summary form.
ProbitCoeff(R1, lab, raw, head, alpha, iter, guess) – calculates the probit regression coefficients for data in raw or summary form. Output includes the standard errors, Wald statistic, p-value, and 1 – α confidence interval. If head = TRUE then R1 includes column headings. Any row in R1 containing non-numeric data is treated as missing data and is not included in the analysis.
ProbitCoeff2(R1, R2, lab, head alpha, iter, guess) – calculates the probit regression coefficients as for ProbitCoeff. R1 contains the data for the independent variables and R2 contains the data for the dependent variable. If R2 has one column then the data is in raw format, while if R2 has two columns then the data is in summary format. R1 and R2 can contain non-numeric data; the function treats these as missing data and doesn’t include them in the analysis. Any row in R1 combined with R2 containing non-numeric data is treated as missing data and is not included in the analysis.
ProbitCoeffs(R1, iter) – outputs an n+3 × 1 range, where n = # of columns in R1, consisting of the n+1 probit coefficients for R1, an empty cell, and the # iterations actually made; iter = maximum # of iterations (default 20).
ProbitTest(R1, lab, raw, iter) – calculates LL of the full and reduced models, the chi-square statistic, and the p-value for the data in range R1
ProbitRSquare(R1, lab, raw, iter) – calculates LL of the full and reduced models and three versions of R2 (McFadden, Cox and Snell, Nagelkerke) as well as AIC and BIC
Here the arguments lab, raw, head, alpha, iter, and guess are optional.
Function Arguments
When lab = TRUE then the output includes row and/or column headings, while if lab = FALSE (default) only the data is outputted.
When raw = TRUE then the data in R1 is in raw form and when raw = FALSE (default) then the data in R1 is in summary form. alpha is used to calculate a confidence interval and takes a value between 0 and 1 with a default value of .05. iter determines the number of iterations used in the Newton method for calculating the probit regression coefficients; the default value is 20. guess is the initial guess for the regression coefficients; the default is to initialize all the coefficients to zero.
Non-array Functions
The Real Statistics Resource Pack also provides the following functions:
ProbitPred(R0, R1, raw, iter) – outputs the probability of success for the values of the independent variables contained in each row of the range R0 based on the probit regression model calculated from the data in R1 (without headings)
ProbitPredC(R0, R2) – outputs the probability of success for the values of the independent variables contained in each row of the range R0 based on the probit regression coefficients contained in R2 (in the form of a column vector)
Relationship with Logistic Regression Functions
The LogitSummary, LogitSelect, LogitReduce, and LogitMatches functions can also be used for probit regression.
The Real Statistics Resource Pack provides the ProbitCoeff, ProbitLL, ProbitCov, ProbitConverge, ProbitROC and ProbitAUC functions that correspond to the LogitCoeff, LogitLL, LogitCov, LogitConverge, LogitROC and LogitAUC functions described in Real Statistic Capabilities for Logistic Regression. These functions also take the same arguments.
Data Analysis Tool
Real Statistics Data Analysis Tool: The Real Statistics Resource Pack provides the Logistic and Probit Regression data analysis tool for performing probit regression analysis.
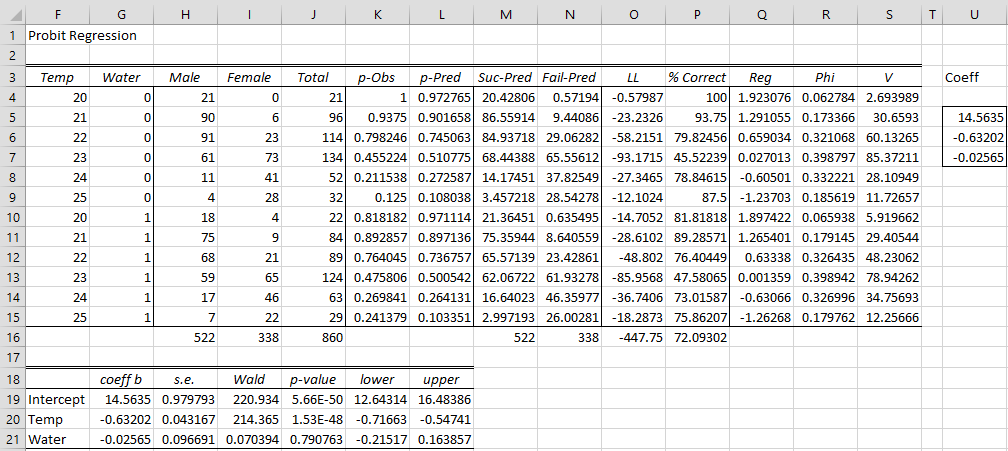
Example 1: Repeat Example 1 of Comparing Logistic Regression Models using the probit model instead of the logistic regression model (the data is repeated in range F3:I15 of Figure 1).
Press Ctrl-m to bring up the menu of Real Statistics data analysis tools and choose the Logistic and Probit Regression option from the Reg tab (or from the Regression dialog box if using the original user interface).
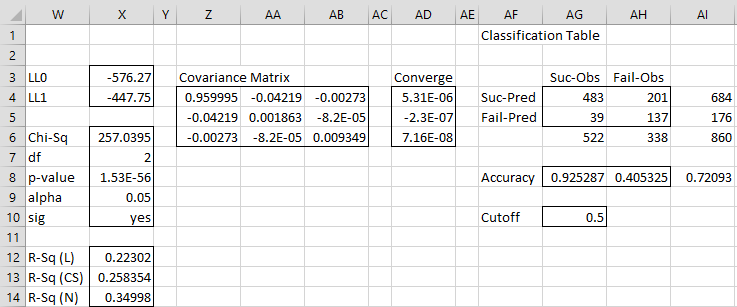
Fill in the dialog box that appears as shown in Figure 2 of Finding Logistic Regression Coefficients using Newton’s Method, except that this time select the Probit option. When you press the OK button, the output shown in Figures 1 and 2 is displayed (with the ROC Table and chart omitted).
Figure 1 – Probit regression output (part 1)
Figure 2 – Probit regression output (part 2)
Comparisons with Logistic Regression
The output format is similar to that used for Logistic Regression. The regression coefficients are not the same, but values such as LL1, chi-square, R-Sq, classification table, and ROC are similar or identical to those produced by the logistic regression data analysis tool.
In general, the logistic regression coefficients are about 1.838 times the corresponding probit coefficients.
Some specific formulas in Figures 1 and 2 that are different from the corresponding formulas for logistic regression are as follows:
Cell L4 contains =NORM.S.DIST(Q4,TRUE)
Cell Q4 contains =$U$5+MMULT(F4:G4,$U$6:$U$7)
Cell R4 contains =NORM.S.DIST(Q4,FALSE)
Cell S4 contains =(H4*(Q4*R4/L4+(R4/L4)^2)-I4*(Q4*R4/(1-L4)-(R4/(1-L4))^2))
Range Z4:AB6 contains
=MINVERSE(MMULT(TRANSPOSE(DESIGN(F4:G15)),S4:S15*DESIGN(F4:G15)))
If you uncheck the Item by item details in output option on the dialog box (as shown in Figure 1 of Real Statistic Capabilities for Logistic Regression, then the output is similar to that shown in Figures 2, 3, and 4 of Real Statistic Capabilities for Logistic Regression, except that the Probit values corresponding to the logistic regression values shown in those figures are displayed instead.
Examples Workbook
Click here to download the Excel workbook with the examples described on this webpage.
References
Wikipedia (2017) Probit model
https://en.wikipedia.org/wiki/Probit_model
Spermann, A. (2009) The Probit model
No longer available online
Demidenko, E. (2001) Computational aspects of probit model. Mathematical Communications 6(2001), 233-247.
https://hrcak.srce.hr/file/1594


Sir,
Could you please explain how to form a Probit Graph using RealStatistics?
Thank you
Hello Michael,
Can you explain what sort of graph you are looking for? Are you looking for a plot of the probit function or something else?
Charles
Sir ,
Could you please tell how to find the transition probabilities from ordered probit model in excel ?
Thank you
Real Statistics doesn’t yet support ordered probit. See the following for ordered logistic regression:
Ordered logistic regression
Charles
Hi,
I have a problem with the probit analysis. The Logit works fine however when I try to perform a probit all predictions are 50% and thereby the whole analysis failed. Do you know what could be the problem?
Keep up the great work!
cheers
Haipeng
Haipeng,
If you email me an Excel file with your data and and analysis, I will try to figure out what is going on.
Charles