Basic Concepts
The following four measures are interrelated:
- sample size
- effect size (which is related to variance)
- alpha (significance level)
- power (which is related to beta)
In particular, for a given sample size and effect size, the lower the alpha the higher the beta (i.e. the lower the power) and vice versa.
Objectives
Usually, we are interested in the following two consequences of the interaction of the above four parameters:
Calculate the minimum sample size (a priori): Prior to conducting an experiment, it is important to determine the minimum sample size necessary to achieve the desired statistical power based on an assumed alpha and estimated effect size. The effect size is based on similar experiments, theoretical considerations, or as a last resort commonly used guidelines (e.g. those of Cohen described in Standardized Effect Size).
Calculate the power of a test (post hoc): After conducting a specific statistical test with a selected alpha and sample size, you can determine the effect size, and then calculate the power of the test. If the power is at least as large as some other target value (usually .80 or .90), then you can be confident that the power of the test is sufficient to detect the effect (i.e. produce a significant result if the effect is larger than this effect size). But if the power is lower than this value then you need to consider repeating the experiment with a larger sample if this is practical.
Example
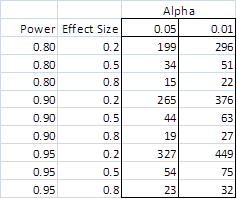
The table in Figure 1 gives some idea of how the minimum sample size varies based on the alpha, effect size, and power parameters (a priori analysis). The example is for the two-tailed Student’s t-test for a single sample (see One Sample t Test) where d = .2 represents a small effect, d = .5 represents a medium effect and d = .8 represents a large effect.
Figure 1 – Sample size requirements
E.g. the first line of the table shows that a sample of size 199 or more is needed to detect an effect of size d = 0.2 with power 1 – β = 0.80 and α = 0.05. To achieve power of 90% requires a sample of size 265, but if you only need to detect an effect of size .5, then you only need a sample of size 44 to achieve 90% power.
Resources
The Real Statistics Resource Pack provides several worksheet functions for carrying out both a priori and post hoc tests in Excel. We illustrate these via numerous examples throughout this website (see, for example, Power and Sample Size, Statistical Power of the t-Tests, Power for One-way ANOVA, etc.).
The Real Statistics Resource Pack also provides a data analysis tool that calculates power and sample size requirements for thirteen statistical tests. Click here to access a description of this data analysis tool.
If you need power and sample size capabilities beyond those provided by the Real Statistics Resource Pack there are software programs that can do this for you. One such program, G*Power, is available for free online.
Examples Workbook
Click here to download the Excel workbook with the examples described on this webpage.
References
Howell, D. C. (2010) Statistical methods for psychology, 7th Ed. Wadsworth. Cengage Learning
https://labs.la.utexas.edu/gilden/files/2016/05/Statistics-Text.pdf
Zar. J. H. (2010) Biostatistical analysis 5th Ed. Pearson
Faul, F., Erdfelder, E., Buchner, A., & Lang, A. G. (2009). Statistical power analyses using G*Power 3.1: Tests for correlation and regression analyses. Behavior Research Methods, 41, 1149-1160.
http://link.springer.com/article/10.3758/BRM.41.4.1149
STAT (2015) Power and sample size reference manual, release 13
http://www.stata.com/manuals13/pss.pdf
Bhandari, P. (2023) Statistical power and why it matters | a simple introduction
https://www.scribbr.com/statistics/statistical-power/

I am very curious about how the precision of the measurement method or device affects statistical power. I imagine that more precise measurements would improve statistical power but do not see how this is taken into account by the calculation. Thank you!
I don’t know of any direct link between precision and power.
Charles
My view on how precision affects power…
As the effect size rises, for example from 0.2 to 0.5, we think the difference between the hypothesized mean and the true mean is larger. As the means of the distributions go farther apart in theory, beta will decrease, power will increase, for the same sample size and alpha. So if we want a higher effect size keeping the same level of power, we reduce the sample size. The less precise sample size allows the power to decrease.
I’ve sent the request asking to help initiating the RealStatistics pack with Excel 2010 on Dec 2d. I did not receive see the answer.Where should I expect the answer? Did I missed it? Have it appeared on Dec 2d?
Mark,
My response can be found on the same webpage from where you made your comment. Here is the response I sent you then:
What do you see when you enter the following formula? VER()
Charles