Worksheet Function
To generate one imputation using the FCS algorithm we can use the following Real Statistics function.
Real Statistics Function: The Real Statistics Resource Pack furnishes the following array function where R1 is a range containing data in which any blank or non-numeric element is considered to be missing data, R2 is a range containing constraints (if R2 is omitted then no constraints are used) and iter is the maximum number of iterations used to obtain a value within the min/max constraints (default = 25).
If head is TRUE (default) then it is assumed that the data range R1, as well as the output, contain column headings, while if head = FALSE then R1 should not contain column headings and the output will not contain column headings either.
The argument iterf is the number of iterations of the FCS algorithm (default = 20), i.e. the number of cycles through all the variables.
ImputeFCS(R1, head, iterf, R2, iter) – generates an array containing one imputation of the missing data in R1.
Example
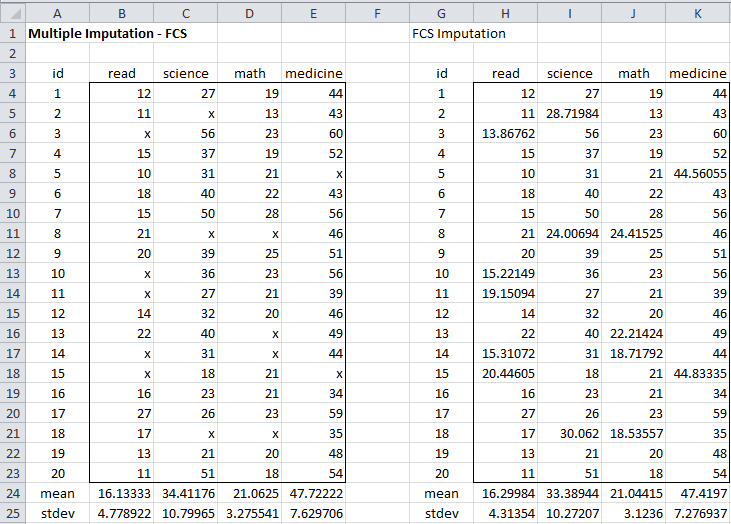
For example, =ImputeFCS(B3:E23,,50) can result in the output in range H3:K23 of Figure 1 for the data on the left side of the figure. Here “x” represents missing data.
Figure 1 – Complete imputation using FCS
Here we use 50 iterations of the FCS algorithm. The head argument defaults to TRUE and no constraints are used.
Example with constraints
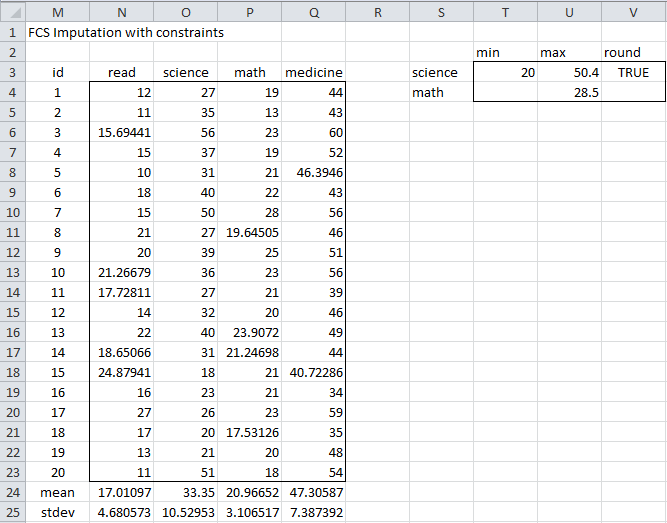
Figure 2 is an example of the possible output where constraints are employed. The array formula =ImputeFCS(B3:E23,TRUE,,S3:V4) results in the output in range H3:K23 of that figure.
Figure 2 – FCS imputation with constraints
Here we use the default of 20 iterations of the FCS algorithm. The head argument is TRUE, the constraints in range S3:V4 are used with the default 25 iterations if the value is outside the specified range.
More Worksheet Functions
We next describe the output from Figure 1 using the following Real Statistics functions.
Real Statistics Functions: The Real Statistics Resource Pack furnishes the following array functions where R1 is a range such as B3:E23 in Figure 8 if head = TRUE or B4:E23 in Figure 1 if head = FALSE (default).
MISummary(R1, head) – generates an array with a compact summary of the regression model where the last column in R1 is assumed to be the data for the y variable and the other columns are assumed to contain the data for the x variables.
ImputedData(R0, R1, head) – generates an array with all the elements in R1 where there is missing data in R0.
DescStats(R1, lab, head) – generates an array containing a mini descriptive statistics report with the statistics count, mean, standard deviation, minimum and maximum for the data in R1. If lab = TRUE then an extra column is inserted in the output which contains labels, while no extra column is added if lab = FALSE (default).
DescStats(R1, lab, head, R0) – generates a mini descriptive statistics report with the statistics count, mean, standard deviation, minimum and maximum for the data in range R1 which correspond to the missing data in R0. If lab = TRUE then an extra column is inserted in the output which contains labels, while no extra column is added if lab = FALSE (default).
Examples
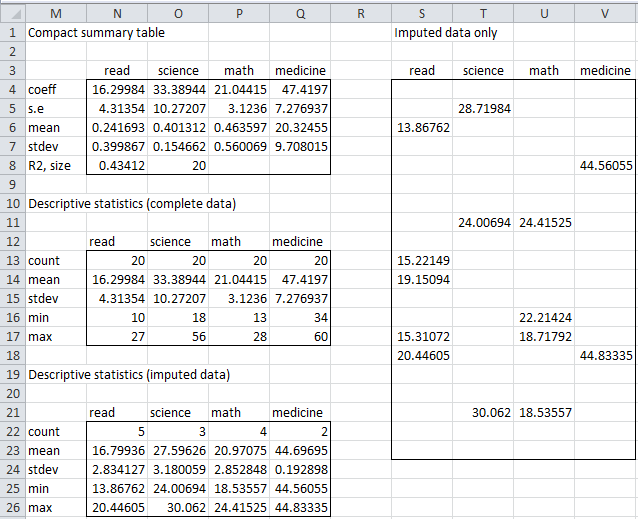
Figure 3 contains examples of these array functions.
Figure 3 – FCS Summary
=MISummary(H3:K23,TRUE) generates the output in range N3:Q8 of Figure 3. Here row 4 contains the regression coefficients where the entry corresponding to medicine (cell Q4) is the intercept coefficient. Row 5 contains the standard errors of the regression coefficients from row 4. Cell N8 contains the value of R2.
=ImputedData(B3:E23,H3:K23,TRUE) generates the output in range S3:V23
=DescStats(H3:K23,TRUE,TRUE) generates the output in range N13:Q17
=DescStats(H3:K23,TRUE,TRUE,B3:B23) generates the output in range N22:Q26
Examples Workbook
Click here to download the Excel workbook with the examples described on this webpage.
References
UCLA (2021) How do I perform multiple imputation using predictive mean matching in R
https://stats.oarc.ucla.edu/r/faq/how-do-i-perform-multiple-imputation-using-predictive-mean-matching-in-r/
Murray, J. S. (2018) Multiple imputation: a review of practical and theoretical findings
https://projecteuclid.org/journals/statistical-science/volume-33/issue-2/Multiple-Imputation-A-Review-of-Practical-and-Theoretical-Findings/10.1214/18-STS644.full
Woods, A. D. et al. (2021) Missing data and multiple imputation decision tree. PsyArXiv
https://doi.org/10.31234/osf.io/mdw5r
Tufis, C. (2008) Multiple imputation as a solution to the missing data problem in social sciences
https://www.revistacalitateavietii.ro/journal/article/download/538/458/883


Sir,
I sent you an email with my excel file. Thank you!
Kevin,
I received your email and will look at it shortly.
Charles
Dr. Zaiontz,
I was able to duplicate your example above using the ImputeFCS function. I then tried to use that function to impute some of my own data and the function keeps returning “value”. I’m using worldbank data which is infamous for having missing values so I thought maybe I was running into issues with too much missing data so I tried to cut out some of the variables that were missing a lot. I still ran into the same issue. Can you try to help me trouble shoot what I am doing wrong?
-Kevin
Kevin,
If you email me an Excel file with your data and results, I will try to figure out what is going wrong.
Charles
I am not sure how to get the output to work. I use the function =ImputeFCS(B3:E23,,50) but only the word read shows up in the output range. Any suggestions?
Aaron,
ImputeFCS is an array function and so you can’t simply press the Enter key. See the following webpage regarding how to use such a function:
Array Formula and Function
Charles