The following worksheet function combines the compact summaries from the multiple imputations to create one combined MI summary, as described in Combining Multiple Imputations.
Worksheet Function
Real Statistics Function: The Real Statistics Resource Pack furnishes the following array function.
MICombine(R1, nimp, ncols, head, raw) – generates a combined compact regression summary derived from the compact summaries of nimp imputations if raw = FALSE or derived directly from the nimp imputations if raw = TRUE (default).
If raw = FALSE then R1 is the range containing the first of the nimp compact regression summaries. If raw = TRUE then R1 is the range containing the first of the nimp imputations.
The nimp imputations or compact regression summaries are separated by ncols blank columns (default = 1).
If head = FALSE (default) then no headings are used, while if head = TRUE then R1 contains column headings as well as the combined compact regression summary.
Example
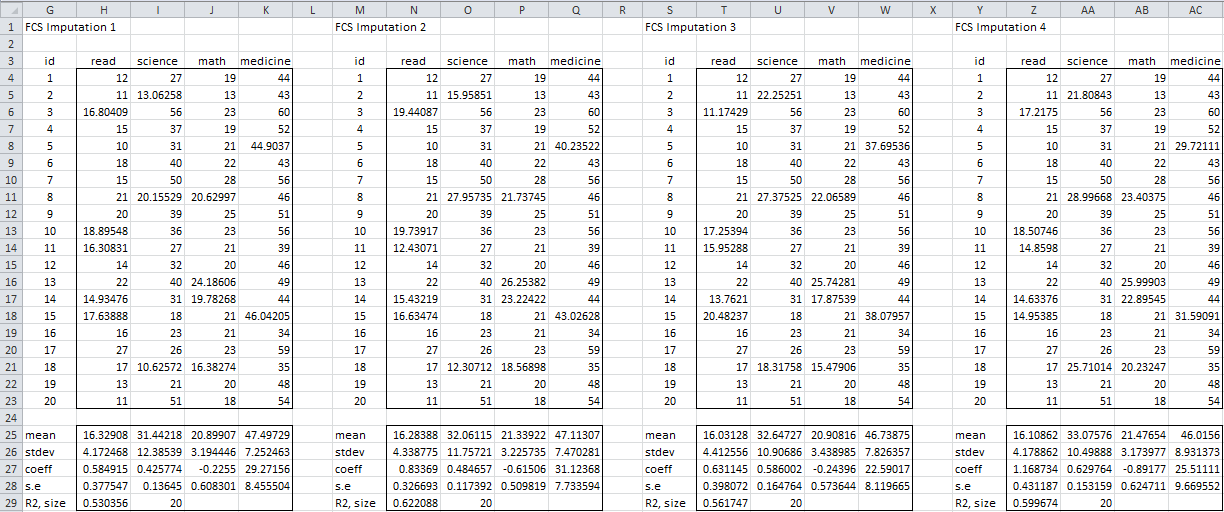
We now illustrate this function using the results of Figure 1 of Combining Multiple Imputations, which we replicate here in Figure 1.
Figure 1 – Multiple Imputations
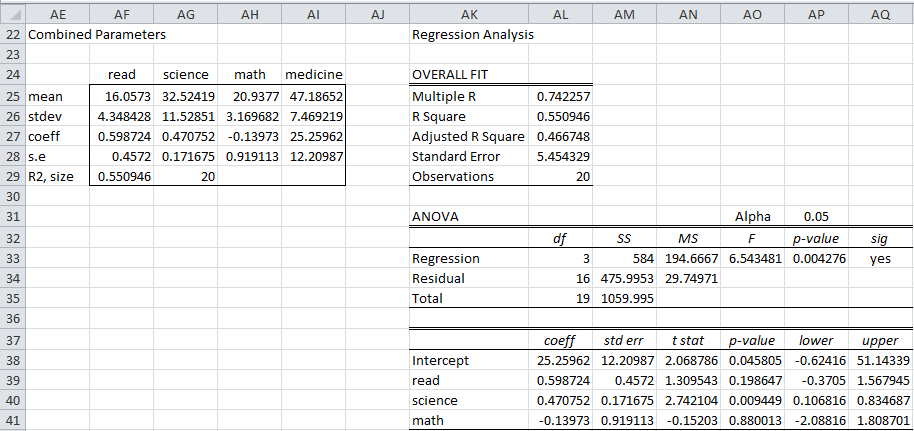
Using =MICombine(H25:K27,4,2,FALSE,FALSE), we get the results shown in range AF25:AI29 of Figure 2.
Figure 2 – Multiple regression with missing data
From the combined summary, the regression analysis shown on the right side of Figure 2 can be generated.
Data Analysis Tool
Real Statistics Data Analysis Tool: The Real Statistics Resource Pack provides the Multiple Imputation (MI) data analysis tool which streamlines the process described throughout this section.
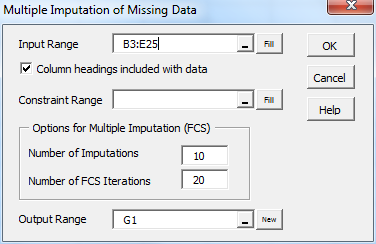
To use this data analysis tool to create a regression model for the data in range B3:E23 of Figure 1 of FCS Overview press Ctr-m and select the Multiple Imputation (MI) data analysis tool. When the dialog box appears as described in Figure 3 fill in the fields as described in the figure and click on the OK button. Note that the Column headings included with data field must be checked.
Figure 3 – Multiple Imputation data analysis tool dialog box
The output will consist of (1) the Descriptive Statistics, Frequency of Non-Missing Data and Missing Patterns reports, (2) 10 imputations of the missing data including Compact Summaries (on a separate worksheet), and (3) a Combined Summary and Regression report.
If the Constraints Range on the dialog box in Figure 3 is filled in with say the range S3:V4 from Figure 2 of One Complete Imputation using FCS, then these constraints will be used in creating the multiple imputations.
Examples Workbook
Click here to download the Excel workbook with the examples described on this webpage.
References
UCLA (2021) How do I perform multiple imputation using predictive mean matching in R
https://stats.oarc.ucla.edu/r/faq/how-do-i-perform-multiple-imputation-using-predictive-mean-matching-in-r/
Murray, J. S. (2018) Multiple imputation: a review of practical and theoretical findings
https://projecteuclid.org/journals/statistical-science/volume-33/issue-2/Multiple-Imputation-A-Review-of-Practical-and-Theoretical-Findings/10.1214/18-STS644.full
Woods, A. D. et al. (2021) Missing data and multiple imputation decision tree. PsyArXiv
https://doi.org/10.31234/osf.io/mdw5r
Tufis, C. (2008) Multiple imputation as a solution to the missing data problem in social sciences
https://www.revistacalitateavietii.ro/journal/article/download/538/458/883


Dear Charles,
Does it make sense to run multiple imputation in the RS with two non-stationary time series? The series of the dependent variable has missing values whereas the series of the independent variable is complete. Thank you in advance.
Dear Reinaldo,
The multiple imputation approach described on the Real Statistics website doesn’t take the time sequence into account and so may not be effective. See https://www.real-statistics.com/time-series-analysis/stochastic-processes/handling-missing-time-series-data/
for one approach with time series.
Charles
Thank you for the prompt reply.
Hello, I’m having problems with the version of Real Statistics in Office 365 MSO (16.0.13231.20372) 64 bits in the part of Reg Confidence/Prediction Interval Chart because when i click ok it says “A run time error has ocurred. The analysis tool will be aborted. Error definido por la aplicación o el objeto, and the data that I colocated is like the way that my teacher explains. I tried downloading, using and restarting this two versions Real Statistics Resource Pack for Excel 2010/2013/2016/2019/365 and Real Stastistics 2007 where it couldn’t create the interval. Pd: I tried with another data too but it didn’t work. Thanks for you attention and time.
Renata,
If you email me an Excel file with your data, I will try to determine why you are getting this error message.
Charles
Hi, I get compile error when trying to run the app.
See Compile Error.
Charles
Hi Charles,
thank you – I manage to create the output exactly as you describe. However, my question now is which data I actually use to fill the missing data cells. Hope you can help me out with that.
Best wishes
Hello Gino,
You don’t fill in the missing data cells. Instead you estimate the regression parameters of interest (such as the regression coefficients) without having to fill in the missing values. It is the parameters from the regression analysis that you are interested in anyway (and not the missing values).
Charles
Hi Charles, I see. Great, I thought so, just wanted to confirm. Many thanks!
Hi Charles, another question, though. Is it also possible to make use of the imputation technique while performing a logit regression which I would like to use for propensity score matching.
Thanks in advance
Hello Gino,
Yes, you can use the same imputation techniques for logistic regression.
Charles
Hi Charles,
thank you! Do you have a hint regarding how I could do that technically? On my computer, the MI function directly creates the multiple regression analysis and the imputations on a separate work sheet. How is it possible to run the logistic regression with the imputed data? Apologies if the questions seems silly.
Hi Gino,
If you send me an Excel file with your data, I will try to figure out how to impute the missing data.
Please make it clear which is the dependent variable (with 0 and 1’s).
Charles