If an imputation falls outside the normal range of a particular variable then the random value can be drawn again or some default setting can be made. Similarly, if a discrete variable is modeled as continuous its imputed value can be rounded off to an acceptable value (although this will introduce some bias).
Example
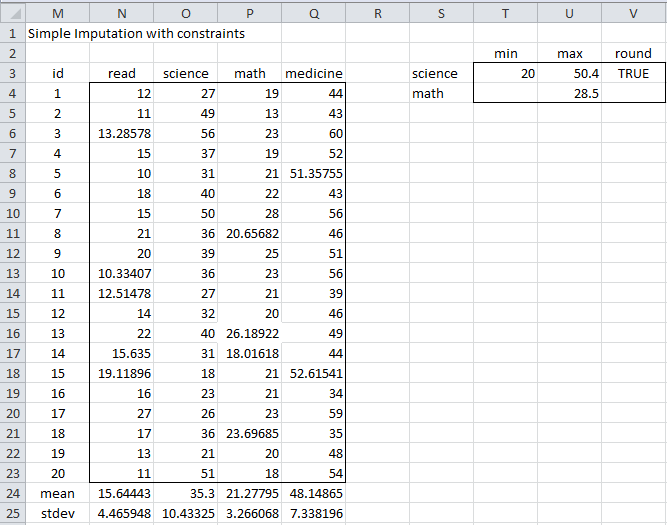
We implement this by using a range of constraints as shown in Figure 1. Here the range S3:V4 contains the constraints. The first column contains the label for the variable with one or more constraints. The second and third columns contain the minimum and maximum acceptable values for that variable (or blank if that constraint is not needed for the referenced variable). The fourth column contains TRUE or FALSE (or equivalently blank), where TRUE means that the referenced variable is rounded off to the nearest integer.
Figure 1 – Simple imputation with constraints
Thus, the constraints shown in Figure 1 indicate that the science variable can only take values between 20 and 50.4 and that any values generated will be rounded off to the nearest integer. The only constraint on the math variable is that its maximum value is 28.5, while there are no constraints on the other variables.
Using these constraints, the initial imputation for the data in Figure 1 of Fully Conditional Specification Overview is shown in range N4:Q23 of Figure 1 above. As described above, if the algorithm generates a value outside the min/max range then another value is generated. This is done a fixed number of times. If a valid value is not found then the minimum or maximum constraint is used (depending on whether the last generated value is below the min or above the max).
Note that these constraints are used not just for the initial step of the FCS algorithm, but also in subsequent steps of the iteration.
Worksheet Functions
Real Statistics Functions: The Real Statistics Resource Pack furnishes the following array function where R1 is a range containing data in which any blank or non-numeric element is considered to be missing data, R2 is a range containing constraints (if R2 is omitted then no constraints are used) and iter is the maximum number of iterations used to obtain a value within the min/max constraints (default = 25). If head is TRUE (the default) then it is assumed that the data range R1, as well as the output, contains column headings, while if head = FALSE then the R1 should not contain column headings and the output will not contain column headings either.
ImputeSimple(R1, head, R2, iter) – generates an array with all the missing data in R1 filled in using the simple imputation approach described in Fully Conditional Specification Overview.
Thus, referring to Figure 2 of Fully Conditional Specification Overview, =ImputeSimple(B3:E23) generates the output in range H3:K23 of that figure, while =ImputeSimple(B3:E23,,S3:V4) generates the output in range N3:Q23 of Figure 1 above.
The current implementation of ImputeSimple uses only the algorithm for continuous variables and not the algorithm for categorical variables. Categorical variables are handled as continuous variables which are rounded off to an acceptable categorical value. This will be improved in a subsequent release of the software.
Examples Workbook
Click here to download the Excel workbook with the examples described on this webpage.
References
UCLA (2021) How do I perform multiple imputation using predictive mean matching in R
https://stats.oarc.ucla.edu/r/faq/how-do-i-perform-multiple-imputation-using-predictive-mean-matching-in-r/
Murray, J. S. (2018) Multiple imputation: a review of practical and theoretical findings
https://projecteuclid.org/journals/statistical-science/volume-33/issue-2/Multiple-Imputation-A-Review-of-Practical-and-Theoretical-Findings/10.1214/18-STS644.full
Woods, A. D. et al. (2021) Missing data and multiple imputation decision tree. PsyArXiv
https://doi.org/10.31234/osf.io/mdw5r
Tufis, C. (2008) Multiple imputation as a solution to the missing data problem in social sciences
https://www.revistacalitateavietii.ro/journal/article/download/538/458/883

Dear Charles, I’ve tried to reproduce the example above but it didn’t work. First I entered on a cell “=ImputeSimple” and pres Ctrl Shift + Enter, and it gave me the arguments of the function. As on my worksheet the array with headings is from B3 to E23 and the constraints from G3 to J4, I entered the following =ImputeSimple(B3:E23,TRUE,G3:J4) and then press Crtl Shift + Enter, and the only output was on the cell where I entered the function the content of cell B3 that is the heading ” read” of the first column, and the function finished like this: {=ImputeSimple(B3:B23,TRUE,G3:J4)}
What am I doing wrong?
Thanks
Carlos,
If you send me an Excel file with your calculations, I will try to figure out what is going wrong.
Also, what do you see when you enter the formula =VER() in any cell?
Charles
Dear Charles,
I’m sending the Excel File ” Handling Missing Values” attached to an email to czaiontz@gmail.com with Subject: problem with ImputeSimple.
As you’ll see the =VER() gives 5.6 Excel.
Thanks and regards
Dr Charles,
My excuses! I’ve just realised that I was doing a stupid thing. Everything is now running smoothly and enjoying the beauty of Real Statistics.
Thanks & regards.