Frequency of missing data
We illustrate the FCS procedure for performing multiple imputation by using the data in range A3:E23 of Figure 1.
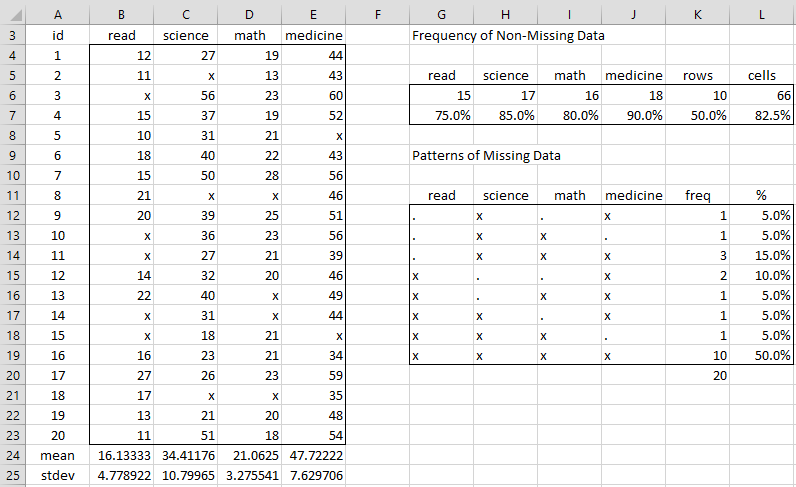
Figure 1 – Frequency and Patterns of Missing Data
Before showing how to perform the FCS procedure we look at the frequency of missing data (or equivalently the frequency of non-missing data) and the patterns of missing data.
The table in range G6:L7 contains the frequencies of non-missing data. E.g. the number of missing data elements for the read variable (cell G6) is 15, as calculated by the formula =COUNT(B4:B23). Since there are 20 rows in the data range, the percentage of non-missing cells for read (cell G7) is 15/20 = 75%, which can be calculated by =G6/COUNTA(B4:B23).
The number of rows with no missing data (cell K6) is 10, as calculated by the Real Statistics formula =CountFullRows(B4:E23,FALSE).
The number of non-missing cells (cell L6) is 66, which can be calculated by =COUNT(B4:E23). Thus the percentage of non-missing cells (cell L7) is 82.5%, which can be calculated by the formula =L6/COUNTA(B4:E23).
Worksheet Functions
Real Statistics Functions: The Real Statistics Resource Pack furnishes the following two array functions and one non-array function where R1 contains data in which any blank or non-numeric element is considered to be missing data.
MissingFreq(R1, head) – generates a frequency of non-missing data table for range R1 like the one in range G5:L11 of Figure 1
MissingPatterns(R1, head, s) – generates a missing patterns table for R1 like the one in range G11:L19 of Figure 1
CountPatterns(R1) = the number of different missing data patterns there are for the data in R1
If head is TRUE (the default) then it is assumed that R1, as well as the output, contain column headings, while if head = FALSE then R1 should not contain column headings and the output will not contain column headings either. E.g. =MissingFreq(B3:E23) produces the output in range G5:L11, while =MissingFreq(B4:E23,FALSE) produces the output in range G6:L11.
The argument s is used to fill up any extra rows in the output which do not contain data. If s is not specified then it defaults to the error value #N/A.
Patterns of missing data
The missing patterns table (range G11:L19 of Figure 1) lists all the possible missing data patterns present in the data range (range B4:E23) where an x stands for data and a . (period) stands for missing data. For each such pattern, the number of rows with that pattern is shown (freq) as well as the percentage of rows with that pattern (%).
For the data in Figure 1, we see that there are eight patterns, with the most frequent pattern being the one with no missing data (freq = 10, 50%).
Examples Workbook
Click here to download the Excel workbook with the examples described on this webpage.
Links
References
UCLA (2021) How do I perform multiple imputation using predictive mean matching in R
https://stats.oarc.ucla.edu/r/faq/how-do-i-perform-multiple-imputation-using-predictive-mean-matching-in-r/
Murray, J. S. (2018) Multiple imputation: a review of practical and theoretical findings
https://projecteuclid.org/journals/statistical-science/volume-33/issue-2/Multiple-Imputation-A-Review-of-Practical-and-Theoretical-Findings/10.1214/18-STS644.full
Woods, A. D. et al. (2021) Missing data and multiple imputation decision tree. PsyArXiv
https://doi.org/10.31234/osf.io/mdw5r
Tufis, C. (2008) Multiple imputation as a solution to the missing data problem in social sciences
https://www.revistacalitateavietii.ro/journal/article/download/538/458/883
Hello.
The MissingFreq and MissingPatterns are not working for me, even when I use your example data. The CountPatterns function does work.
MissingFreq gives me this error:
“Compile error in hidden module: ‘Missing’. This error commonly occurs when code is incompatible with the version, platform, or architecture of this application.”
I am using Excel 2016 on a Mac.
MissingPatterns does not give me an error message, but outputs only one cell, which simply contains the text in the first header cell of R1.
Any ideas about what might be going wrong?
You can disregard my questions. I didn’t realize these were array formulas. I also reloaded the add-in and am no longer getting error messages.
I am having the same problem. Did you find a solution?