Objective
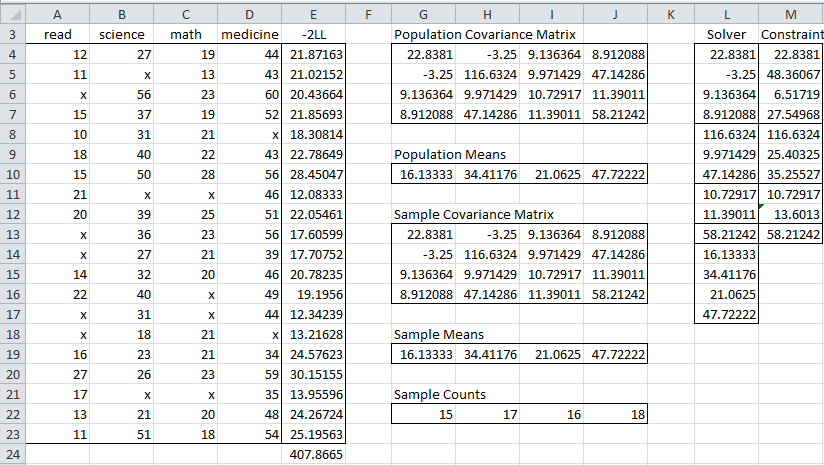
The goal of FIML is to find the values of the population parameters which minimize the value of -2LL. For the example we have been considering (Figure 2 of Initializing FIML, which is repeated here as Figure 1) cell E24 contains the value of -2LL.
Figure 1 – Initialization of FIML procedure
The current value has been set based on setting the population parameters, namely the covariance matrix and mean vector, equal to the sample values.
We show how to minimize the value in cell E24 by varying the population covariance and mean vectors using Excel’s Solver.
Solver Initialization
Since the population covariance matrix must be symmetric, we have some redundancy in its values (namely the upper triangle is completely determined by its lower triangle or vice versa). Thus we will look to vary the cells in the lower triangle of the population covariance matrix (e.g. via the formula =L10 in cell H7) and constrain the upper triangle (e.g. via the formula =H7 in cell J5). We, therefore, arrange the cells to be varied in the range L4:L17, where the first part consists of the non-redundant cells from the population covariance matrix followed by the cells from the mean vector.
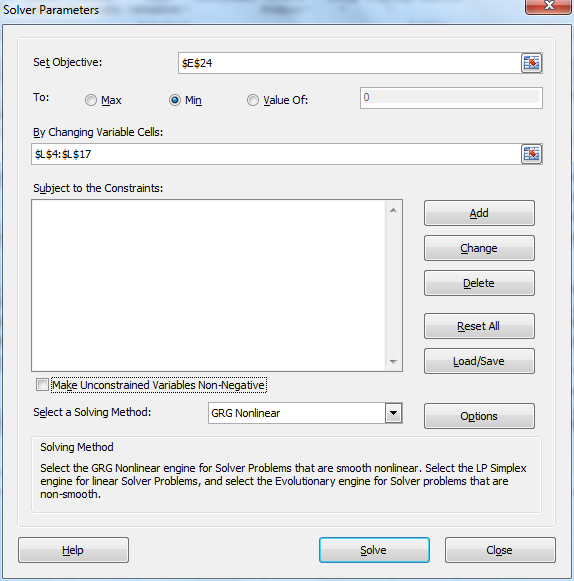
We next select Data > Analysis|Solver. When the Solver dialog box appears we fill in the values as described in Figure 2 and then click on the Solve button.
Figure 2 – Solver dialog box for FIML
It is important to choose Min and to uncheck the Make Unconstrained Variables Non-Negative.
Output from Solver
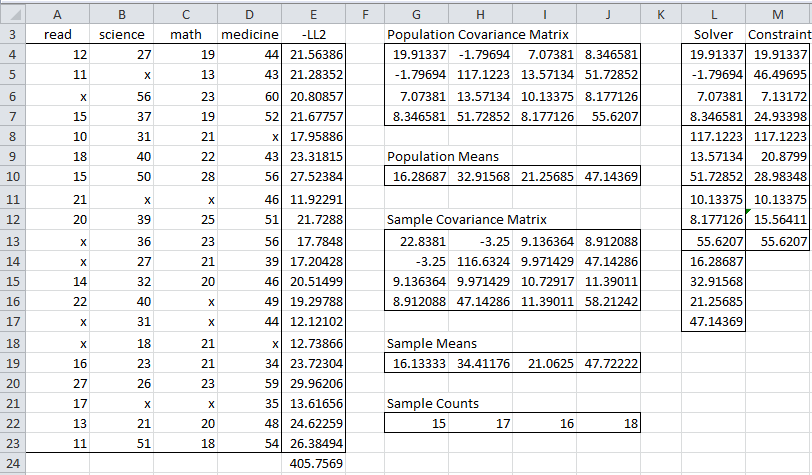
If everything goes well, Solver will find values for the population covariance matrix and mean vector which minimizes -2LL. This result is shown in Figure 3.
Figure 3 – FIML using Solver
Note that the value of -2LL (cell E24) went down from 407.8665 (in Figure 1) to 405.7569 after using Solver. The new values for the population covariance matrix and mean vector are shown in Figure 3 which can be compared with the sample values.
Constraints
We mentioned that the values in the population covariance matrix are constrained. There are additional constraints that we didn’t describe to Solver, but we could have if necessary. Click here for more information about adding these constraints to the Solver iteration.
Examples Workbook
Click here to download the Excel workbook with the examples described on this webpage.
References
Enders, C. K. (2001) The performance of the full information maximum likelihood estimator in multiple regression models with missing data. Educational and Psychological Measurement, Vol. 61 No. 5.
https://asu.elsevierpure.com/en/publications/the-performance-of-the-full-information-maximum-likelihood-estima
Allison, P. D. (2012) Handling missing data by maximum likelihood
https://statisticalhorizons.com/wp-content/uploads/MissingDataByML.pdf


Hi Charles,
Could you please provide more details on how you vary the upper triangle of the covariance matrix and constrain the lower (a breakout of the formulas in the population covariance matrix)? Which one is inclusive of the center line? When you say insert the formula =L5 into G4, did you mean G5 or H4? For the other cells, do you paste the sample variance as value to constrain it or keep it as the covariance formula?
Thanks,
Claire
Sub Solver1()
‘Tabelle1.Unprotect ‘Password:=”xyz”
Worksheets(“FIML”).Activate
SolverReset
SolverOptions AssumeNonNeg:=False
solverok SetCell:=”$E$24″, maxminval:=2, valueof:=0, bychange:=”$L$4:$L$17 “, _
Engine:=1, EngineDesc:=”GRG Nonlinear”
SOLVERsolve True
‘Tabelle1.Protect ‘Password:=”xyz”
End Sub
Then you have to make “reference” for SOLVER.XLAM
Hello Peter,
It looks like your comment contains VBA code for using Solver. Do you have a question or did you want to share the code with the rest of the community?
Charles
Charles:
Is it possible to add a Solver routine in your VBA code, with the purpose of get an automatic FILM procedure (without user intervention)?
Thank you.
William.
William,
This is a good idea. I will look into it.
Charles