Example
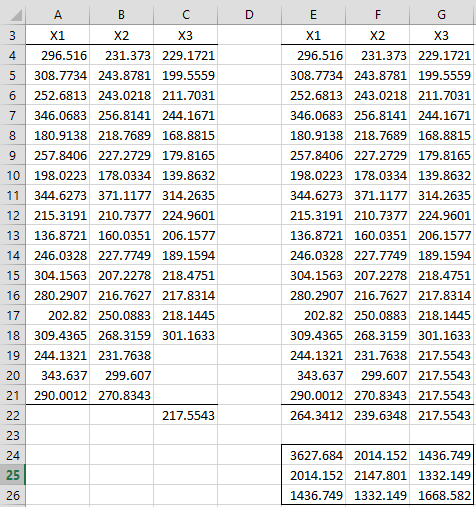
Example 1: Estimate the population parameters (mean vector and covariance matrix) of the trivariate normal distribution for the data in range A4:C21 of Figure 1.
Figure 1 – Trivariate normal data
There are 18 3-tuples of data with three missing cells. In the initial E step, each of the three missing cells is set to the mean of the last column (where the missing cells are located). This is shown in range E4:G21. We now have a complete set of data.
Next, we carry out the first M step by calculating the mean vector as shown in range E22:G22 using the formula =MEANCOL(E4:G21) and the covariance matrix, as shown in range E24:G26 using the formula =COV(E4:G21).
We now perform the next E step by calculating new estimates for the three missing elements by using the formula
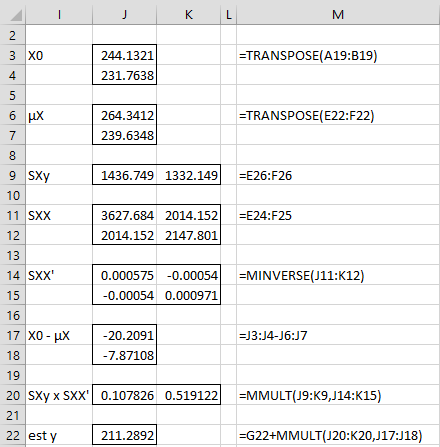
as described in Multivariate Normal Distribution Properties. The calculations for the first missing element (cell C19) is as described in Figure 2.
Figure 2 – Estimating the first missing data element
Thus, we obtain a new estimate of the first missing data element of 211.2892.
This value turns out to be the forecasted value of y based on the multiple linear regression at the given value X0 of X, which for the first missing data element can be calculated by the formula =TREND(G4:G21,E4:F21,A19:B19).
Iterations
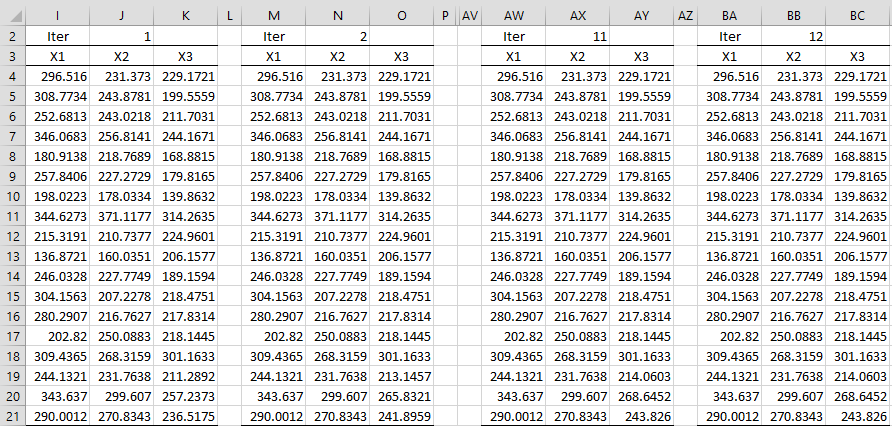
Thus, it is sufficient to carry out iterative multiple linear regressions as shown in Figure 3 (where iterations 3-10 are not displayed).
Figure 3 – EM algorithm using iterative multiple regressions
Range K19:K21 contains the array formula =TREND(G4:G21,E4:F21,I19:J21). Similarly, O9:O21 contains the array worksheet formula =TREND(K4:K21,I4:J21,M19:N21). Convergence (at least to the decimal places displayed) is achieved after 12 iterations. The imputed values for the missing cells are shown in the range BC19:21.
Mean vector and covariance matrix
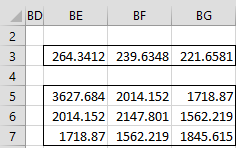
We can now estimate the mean vector and covariance matrix of the population from which the original data was drawn, as shown in Figure 4.
Figure 4 – Estimated mean and covariance matrix
The mean vector in BE3:BG3 is calculated by the array formula MEANCOL(BA4:BC21) and the covariance matrix in BE:BG7 is calculated by the array formula =COV(BA4:BC21).
Examples Workbook
Click here to download the Excel workbook with the examples described on this webpage.
References
Efron and Hastie (2016) Computer age statistical inference. Cambridge University Press
Walczak, B., Massart, (2001) Dealing with missing data: Part II. Chemometrics and Intelligent Laboratory Systems 58 Ž2001. 29–42
https://www.academia.edu/59642526/Dealing_with_missing_data


