We now extend the approach described in EM Multivariate Normal Data with Missing Elements to the case where there are multiple missing data patterns.
Example
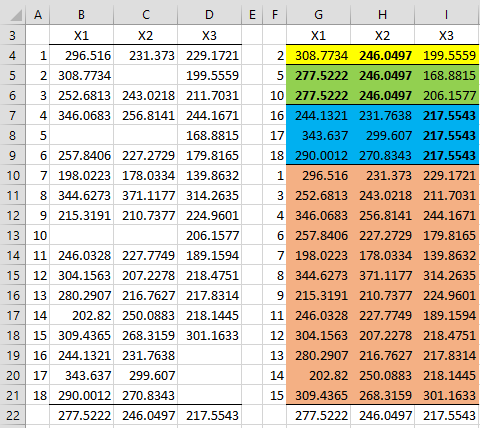
Example 1: Estimate the mean vector and covariance matrix for the multivariate normally distributed population from which the data in range B4:D21 of Figure 1 is taken.
Figure 1 – Multiple patterns of missing data
In this example, we have multiple patterns of missing data, as shown on the right side of Figure 1, where the data is reorganized into four pattern groups. The yellow group is missing data in X2, the green group is missing data in X1 and X2, the blue group is missing data in X3 and the pink group is not missing any data. The actual missing data elements (in bold) are replaced by the mean of the corresponding column.
Iterations
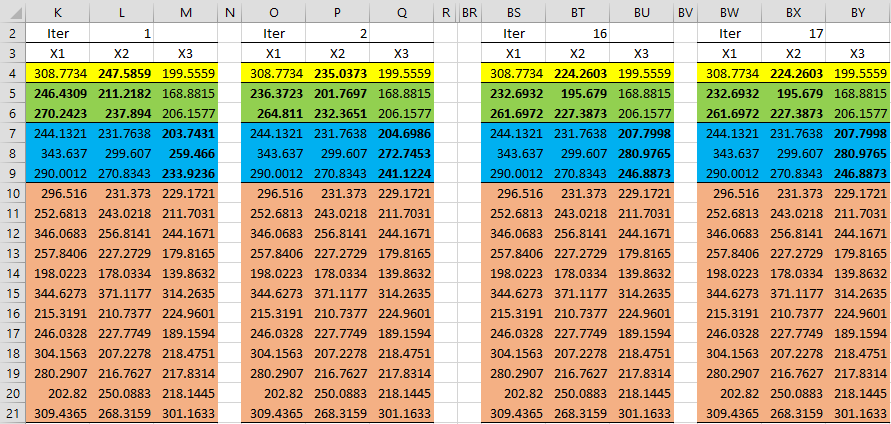
We now perform iterated regressions as in Example 1 of EM Multivariate Normal Data with Missing Elements, achieving convergence after 17 iterations. This is shown in Figure 2 (with iterations 3-15 not displayed).
Figure 2 – Iterations
For example, Q7:Q10 contains the array formula =TREND(M4:M21,K4:L21,O7:P9). P4 contains the array formula =TREND(L4:L21,MERGE(K4:K21,M4:M21),MERGE(O4,Q4)). Since the ranges with the X data for this regression are not contiguous, we use the Real Statistics array function MERGE to combine the ranges.
The imputations for the second pattern (green) require two regressions, one for each column of missing data elements. Range O5:O6 contains the array formula =TREND(K4:K21,M4:M21,Q5:Q6) and range P5:P6 contains the array formula =TREND(L4:L21,M4:M21,Q5:Q6).
Results
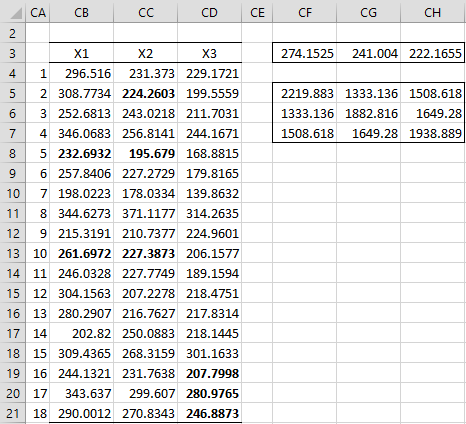
The imputations after convergence are shown in range BW4:BY21, although the order is different from the original order of the data shown on the left side of Figure 1. The left side of Figure 3 shows the final imputations in the correct order. The right side shows the estimates of the population mean vector, using the array formula =MEANCOL(CB4:CD21), and the population covariance matrix, using the array formula =COV(CB4:CD21).
Figure 3 – Results of the EM algorithm
Examples Workbook
Click here to download the Excel workbook with the examples described on this webpage.
References
Efron and Hastie (2016) Computer age statistical inference. Cambridge University Press.
https://www.cambridge.org/core/books/abs/computer-age-statistical-inference/algorithms-and-inference/E2D3BD11B2FC6497C8E735D2422EA7DC
Walczak, B., Massart, (2001) Dealing with missing data: Part II. Chemometrics and Intelligent Laboratory Systems 58 Ž2001. 29–42
https://www.academia.edu/59642526/Dealing_with_missing_data


