Accessing Excel’s Analysis ToolPak
Excel provides a number of data analysis tools, which are accessible via Data > Analyze|Data Analysis.
If this option is not visible you may need to first install Excel’s analysis tool pack. You can accomplish this by selecting Office Button > Excel Options > Add-Ins in Excel 2007 or File > Help|Options > Add-Ins in versions of Excel starting with Excel 2010, and clicking the Go button at the bottom of the window. Next, you select the Analysis ToolPak option on the dialog box that appears and click the OK button. You will then be able to access the data analysis tools.
Main Dialog Box
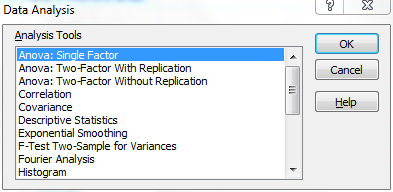
After selecting Data > Analyze|Data Analysis, you will be presented with the dialog box in Figure 1.
Figure 1 – Data analysis dialog box
You can now select any one of the following options useful for statistical analysis:
- ANOVA: Single Factor
- ANOVA: Two-Factor with Repetition
- ANOVA: Two-Factor without Repetition
- Correlation
- Covariance
- Descriptive Statistics
- Exponential Smoothing
- F-Test: Two Sample for Variances
- Histogram
- Random Number Generation
- Rank and Percentile
- Regression
- Sampling
- t-Test: Paired Two Sample for Means
- t-Test: Two-Sample Assuming Equal Variance
- t-Test: Two-Sample Assuming Unequal Variance
- z-Test: Two-Sample for Means
Subsequent Dialog Boxes
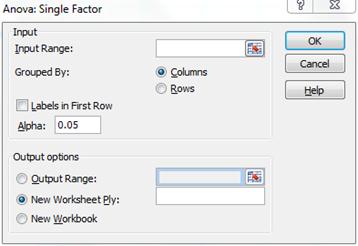
Each of these options represents a data analysis tool that will be described on this website. Now suppose by way of example that you choose Anova: Single Factor. You will now be presented with the dialog box shown in Figure 2.

Figure 2 – Dialog box for Anova: Single Factor option
Fields
The Input Range consists of the Excel range where the data elements to be analyzed are stored. Suppose, by way of example, this data consists of a 4 × 8 array representing 4 treatments as in Figure 3.

Figure 3 – Sample input range
In this case, you insert the range B2:E9 in the Input Range field (of the dialog box of Figure 2) and select the Columns radio button. If you had assigned a name (e.g. Study1) to the range B2:E9 then you could put this name in the Input Range field instead of B2:E9.
Alternatively, you could insert B1:E9 in the Input Range field and check the Labels in First Row checkbox in the dialog box to indicate that you have included the column headings in the data range. Note that the participant numbers (in column A) are not used.
If the data were arranged where the treatments are listed by row instead of by column, then you would select the Rows radio button and you could optionally select the Labels in First Column checkbox.
The Alpha value (as described in Null and Alternative Testing) is set to 0.05 by default, although you can optionally change this to 0.01 or some other value.
You can now choose the New Worksheet Ply radio button from the Output options (and leave the data field blank). In this case, a new worksheet is created (in the tab prior to the current one) and the ANOVA report is placed in this worksheet starting at cell A1. You can then copy the results to the current worksheet (or anywhere else you like).
Alternatively, you can choose the Output Range or New Workbook radio button, to put the report in some specific output range that you choose or in a new workbook.
Reference
Microsoft Support (2012) Use the Analysis ToolPak to perform complex data analysis
https://support.microsoft.com/en-us/office/use-the-analysis-toolpak-to-perform-complex-data-analysis-6c67ccf0-f4a9-487c-8dec-bdb5a2cefab6

I have been using excel programs for over 20 years in my place of employment. I’ve created formulas for spreadsheets that were needed for invoicing and tracking certain numbers. This is the first time I ever heard of ANOVA. Learning it will be challenging but it is worth it.
Hi Charles,
Greetings for the Day !!
which one of the statistical analysis do you suggest for the Market research that is easy to learn as I am a Novice in statistics…..Thanks in advance
Hi Leo,
There are so many tests that could be used. It depends on what sort of market research you want to perform. Common choices include t-tests and chi-square test.
Charles
Thank you Charles. I can confirm the error is NOT caused by the Real Statistics add in: I ‘de-selected’ the add in, closed and re-opened the ‘Real-Statistics-Examples-Part-1A.xlsx’ spreadsheet – and continued to get the same error. So I think that puts the Real Statistics add-in in the clear. I do not get the error when I access Excel’s data analysis toolpak, with the Real Statistics add-in active, when operating on a different spreadsheet. I wonder if there is a formula in the ‘Real-Statistics-Examples-Part-1A.xlsx’ spreadsheet that uses a random number function that somehow clashes with Excel data analysis toolpak? It would not be the first bug in Excel!
Andrew,
It is good to see that the bug is not caused by Real Statistics.
The Part 1A Examples workbook does use RAND() and RANDBETWEEN(). I believe that I also used the Random Number Generator data analysis tool to create some of the data.
Charles
Already learning plenty – and I’ve not yet touched the statistics stuff! However, I seem to have encountered a problem on this page. When I access the Data Analysis tool, a message box appears, “Random Number Generation – The type of distribution is required. Entry must be an integer between 1 and 7.” The box immediately reappears if I click “OK” or if I click on the X in the top right hand corner of the message box. Esc has the same result. My only way to continue is to exit Excel via the Windows Task Manager (Alt-Ctrl-Del) and re-open. I have used the Data Analysis tool before without this problem. Is this problem caused by the Real-statistics add in?
Andrew,
This error is produced by Excel’s data analysis toolpak and not by Real Statistics. I don’t know of any reason why Real Statistics would be the cause of this error, although one Real Statistics user recently reported getting a different Excel data analysis toolpak error when using Real Statistics.
Charles
please guide me in my project, how I can choose the questions for statistical tools & also explain the how it work it out
Divya,
Sorry but your question is way too general. Do you have a more targeted question?
Charles
You might want to add, that for Mac Excel 2013, the data analysis menu appears in the top menu bar as a drop down menu, called “Real Statistics”.
Tina,
This is a good point, but I wasn’t aware of an Excel 2013 version for the Mac. I believe the latest release of Excel for the Mac is Excel 2011. In the bundling of Excel 365 for the Mac, perhaps Microsoft is relabeling Excel 2011 as Excel 2013. Do you know whether Excel 2013 for Mac is different than Excel 2011?
Charles
Dear Dr. Charles
Being a novice in statistics, I came across ANOVA first time on this web page. Could you please explain the fundamentals of ANOVA, what is it, what is its significance, etc.? That would really be helpful for me as well as others who are new into this field.
Thanks
I suggest that you look at the following webpage which will direct you to lots of information about ANOVA.
Analysis of Variance
Charles
Dear Zaiontz,
Truly grateful to you for the wonderful Resource Pack. I encountered a problem here. I installed the resource pack by following your instruction for installation. Installation was smooth and successful, and I tested out several functions of the program and found everything was fine. However, the next day when I came back to use it, I did not even see the program name inside AddIn. Could you please tell me how to correct the problem? Thanks a lot.
Do the functions and data analysis tools still work?
Charles