Excel provides a variety of statistical functions, which we list below. Since these have been covered in the rest of the website, we won’t go into any detail here.
Basic statistical functions
 Figure 1 – Basic Excel statistics functions
Click below for more information about each of these functions:
AVERAGE, MEDIAN, MODE, GEOMEAN, HARMEAN, AVEDEV, DEVSQ, STDEV, STDEVP, VAR, VARP, KURT, SKEW, LARGE, MAX, MIN, PERCENTRANK, PERCENTILE, QUARTILE, RANK, SMALL, AVERAGEIF, AVERAGEIFS, COUNT, STANDARDIZE, TRIMMEAN
Correlation and covariance functions
 Figure 2 – Excel correlation and covariance functions
Click below for more information about each of these functions:
CORREL, COVAR, PEARSON, RSQ, FISHER, FISHERINV
Regression function
 Figure 3 – Excel regression functions
Click below for more information about each of these functions:
FORECAST, INTERCEPT, SLOPE, TREND, LINEST, STEYX, GROWTH, LOGEST
Other statistical functions
 Figure 4 – Other Excel statistical functions
Click below for more information about each of these functions:
Statistical distribution functions
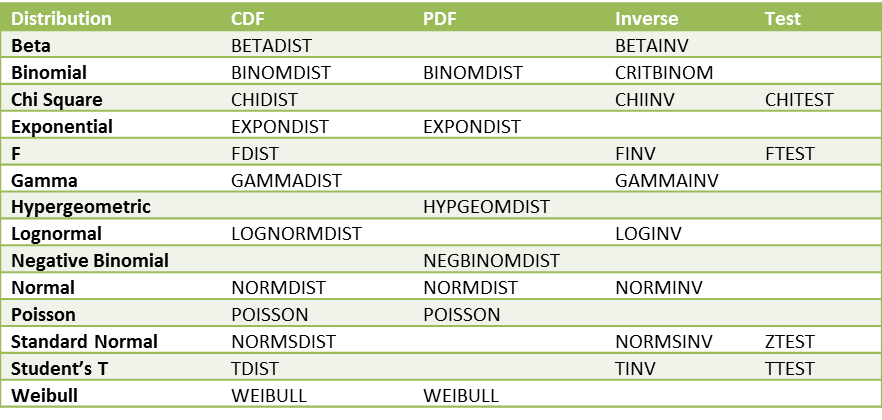
The following table provides a list of the distributions supported by Excel. For each, the name of cumulative distribution functions (CDF) is given, and where available the name of the inverse function is also provided. For a few of the distributions, the CDF function also has an option to provide the probability density function (PDF). Finally, additional test functions are listed where available.
Figure 5 – Excel 2007 distribution functions
Excel 2010 functions
All the functions defined in previous versions of Excel are available in Excel 2010 and later versions of Excel, but the mathematical accuracy of many of these functions has been improved in Excel 2010 and later versions. In addition, a few new functions have been added and more consistent naming conventions have been introduced, including the following:
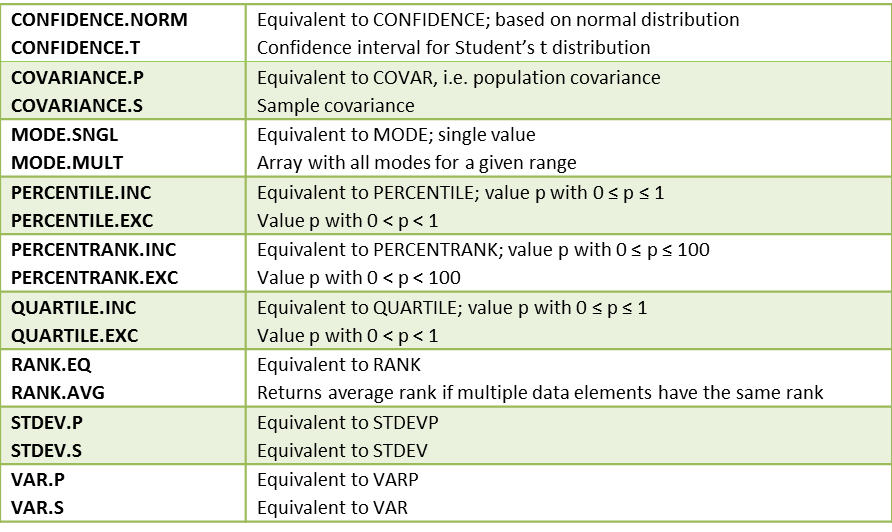
 Figure 6 – New Excel 2010 statistical functions
For example, if R = {4,6,4,7,6,6}, then RANK(4,R) = 5, RANK(6,R) = 2 and RANK(7,R) = 1, while RANK.AVG(4,R) = 5.5, RANK.AVG(6,R) = 3 and RANK.AVG(7,R) = 1. Also RANK.EQ is the same as RANK. Similarly, RANK(4,R,1) = 1, RANK(6,R,1) = 3 and RANK(7,R,1) = 6, while RANK.AVG(4,R,1) = 1.5, RANK.AVG(6,R,1) = 4 and RANK.AVG(7,R,1) = 6.
MODE.MULT is an array function that is useful with multimodal data. Before using the function you need to highlight a vertical range (i.e. column vector) with at least as many cells as modes and then enter =MODE.MULT(R) and Ctrl-Shft-Enter (or simply Enter if using Excel 365). If you highlight more cells than modes the extra cells will contain the error values #N/A.
The function GAMMALN.PRECISE, which is equivalent to GAMMALN, has also been added in Excel 2010.
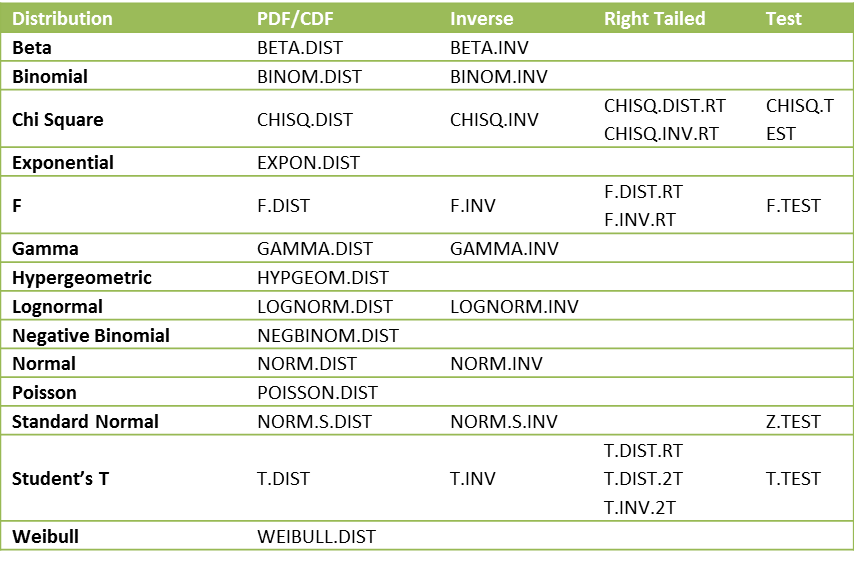
Starting with Excel 2010 there are the following alternative names for the distribution functions:
 Figure 7 – Excel 2010 distribution functions
The functions that end in .DIST all provide both the probability distribution function (when the cum parameter is FALSE) as well as the left-tailed cumulative distribution function (when the cum parameter is TRUE). These are all left-tailed functions. For the chi-square and F distributions, there is also a right-tailed version (indicated by .RT in the above table) of the distribution and inverse cumulative functions. There is also a right-tailed version of the distribution function and a two-tailed version of the t distribution and its inverse.
The syntax for the various new t distribution functions is T.DIST(x,df,cum), T.DIST.RT(x,df) and T.DIST.2T(x,df). The syntax for the new inverse function is T.INV(p,df) and T.INV.2T(p,df). We have the following equivalences between the Excel 2007 and later versions of the t distribution functions:
 Figure 8 – Equivalences for the t distribution
Note that while the old t distribution functions worked differently from the normal and binomial distribution functions, the new functions are all consistent. Also, we can now explicitly calculate the pdf of the t distribution as T.DIST(x, df, FALSE) instead of having to use a complicated formula based on Definition 1 of t Distribution.
We also have the following equivalences between the Excel 2007 and later versions of the chi-square distribution functions:
 Figure 9 – Equivalences for the chi-square distribution
Finally, we can now explicitly calculate the pdf of the chi-square distribution as CHISQ.DIST(x, df, FALSE). The equivalences for the F distribution between Excel 2007 and later versions are similar.

Figure 10 – Equivalences for the F distribution
Excel 2013 functions
All the functions defined in previous versions of Excel are available in Excel 2013, but the following additional functions are available in versions of Excel starting with Excel 2013:
 Figure 11 – New Excel 2013 statistical functions
Excel 2016 forecast functions
The following forecast functions were introduced with Excel 2016. More details about these functions can be found at Excel 2016 Forecasting Functions.
FORECAST.ETS(x, R1, R2, seasonality, missing, aggregation) = the forecasted value at the time value x
FORECAST.ETS.SEASONALITY(R1, R2, missing, aggregation) = the seasonality value (1 for no seasonality, 4 for quarterly, 12 for monthly, etc.) based on the data in R1 and R2
FORECAST.CONFINT(x, R1, R2, 1 – α, seasonality, missing, aggregation) = k such that (x-pred – k, x-pred + k) is the 1 – α confidence interval for the forecasted value x–pred at the time value x; the default value for 1 – α is .95.
FORECAST.ETS.STAT(R1, R2, stat-type, seasonality, missing, aggregation) = a forecasted statistic based on the value of stat-type.
In addition, the FORECAST.LINEAR function has been added which is equivalent to the FORECAST function described in Figure 3 above.
Reference
Microsoft (2021) Excel functions
https://support.microsoft.com/en-us/office/excel-functions-alphabetical-b3944572-255d-4efb-bb96-c6d90033e188#bm6

I am an academic librarian and educator at Trine University in Angola, Indiana. I am seeking permission to use with attribution for education purposes the images posted on this page: https://real-statistics.com/excel-capabilities/built-in-statistical-functions/.
Hello Kristina,
Yes, I grant you this permission. Glad I can help.
Charles
There is an “help” for your function ? My excel doesn’t show it. Thanks a lot.
You can always get help for any of the built-in Excel functions (e.g. via the Formula Bar fx or via tooltips that appear as you type the name of the function).
You can get the Formula Bar fx help for most of the Real Statistics functions in Windows environments starting with Excel 2010.
You can also get limited help information in the Mac environment and older Windows environments by entering the name of the function and then pressing the key sequence Ctrl-A.
These approaches are described at
https://www.real-statistics.com/real-statistics-environment/using-real-statistics-functions/
Charles
thanks very much for this important class. Pls do you have any link where i can learn all those distributions in details e.g. weibull distribution
If you click on the name of the function, you will be forwarded to a webpage that describes the function in more detail. You can also click on the following link: Distributions
Charles
In your “Regression” box above, “FORECAST” is misdescribed as giving a frequency array. Typo, no doubt, easy change. Thanks for all.
Hi Charles,
First of all, thanks for this great tool!! I used to use this add-in without problems but since my office license expired and they installed another one for me (2007 professional plus) I cannot use the formulas. I was able to install the add in correctly ( function VER() give me the write info) but I cannot write the formulas, like =SCORREL..
I have tred to uninstall and install several times and also place the file in different folders..
Do you know what can be happening?
Thanks
Priscila,
It is very strange that one function works, but others don’t. What is the output from the =VER() formula? Have you tried using other function? Do they work?
Charles
Thanks for your fast answer! The output of =VER() is 5.5Excel2007. I also tried other formulas from the list you wrote in the session “Real Statistics Functions” and they didn´t work either..
Priscila,
Very strange.
When you press Alt-TI do you see RealStat-2007 and Solver on the list of addins with check marks next to them? Do you see any other versions of Real Statistics active?
When you press Ctrl-m, what happens?
Charles
Yes, when I press Alt-TI I see both checked and no other version of Real Statistics appear, only the 2007. When I press Ctrl-m the window of the add-in appear and everything seems to be OK. But I cannot do my analisys by the menu window of the add-in because I have a super large array of data, so I need to write the formulas to be able to automatcly reproduce them in all the arrays of the sheet… =(
Thanks so much for the great summary
Few in today ‘s world are given without taking a thing. And you are of little greatest people. Charles, preach, your reward in the hereafter is greater than today.
Mahmoud Arafa
Mahmoud,
Thank you for your comment, but you are too kind. I am just trying to do my part.
Charles
Bakwaas
Khushboo,
It seems that you don’t like this webpage or perhaps the website. What don’t you like?
Charles
Am trying to down load your “Service Pack” to my iPad via Drop Box /I do have your file name identifier RealStats.xlam show up on Drop Box / I also also have the “add-ons” icon in Excel on my I pad – but their not talking to each other …. Can you please give the complete bag of IT tricks so i might use your App on iPad // sure hope it turns out the two are compatible – lest you didnt say – that their Not ! Your App looks like a very comprehensive Stat package, am eager to use on iPad. ( could be a wide market ) Thx. Charles
Great summary , thanks ; found your Eamples Workbook , thank you
Great summary , thanks ; now of coures an example for the use of each would be invaluable for understanding and the mechanics of their use and utility . Again thanks , Charles
Thank u somuch…
Thank You.