Given a collection of data that may fit the Weibull distribution, we would like to estimate the parameters that best fit the data. We illustrate the method of moments approach on this webpage. Elsewhere, we show two other approaches using the maximum likelihood method and regression.
Example
Example 1: Twelve robots were operated until they failed. The time to failure is shown in range B4:B15 of Figure 1. We believe that the data fits a Weibull distribution. Find the scale and shape parameters that best fit the data.
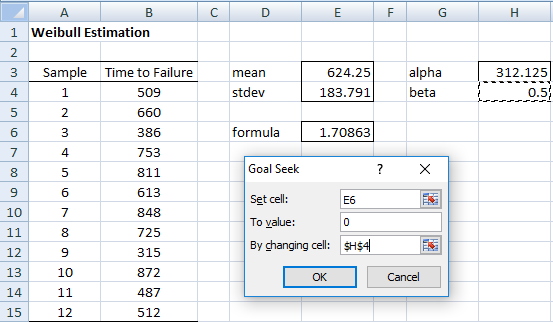
Figure 1 – Fitting a Weibull distribution
We can estimate the mean μ and standard deviation σ of the population from the data in Figure 1. As we saw in Weibull Distribution, once we do this, we can estimate the scale and shape parameters based on the fact that
![]()
Estimating μ by x̄ and σ by s, it then follows that
![]()
Using algebra, we can now eliminate α to obtain
![]()
from which it follows that
![]()
We implement these equations in Excel as shown in Figure 1. In particular, cells E3 and E4 contain the formulas =AVERAGE(B4:B15) and STDEV.S(B4:B15). Cell E6 contains the formula on the left side of the equation that we derived above to find the β parameter, namely =GAMMALN(1+2/H4)-2*GAMMALN(1+1/H4)-LN(E3^2+E4^2)+2*LN(E3). We initially set the value of the β parameter in cell H4 to some guess, i.e. 0.5.
We can now use Excel’s Goal Seek capability to find β. The value for α then follows since

This is implemented in Excel via the formula
=E3/EXP(GAMMALN(1+1/H4)) in cell H3.
As described in Weibull Distribution, we call Goal Seek by selecting Data > What If Analysis|Goal Seek and then filling in the dialog box that appears in Figure 1. After pressing the OK button, the output shown in Figure 2 appears.
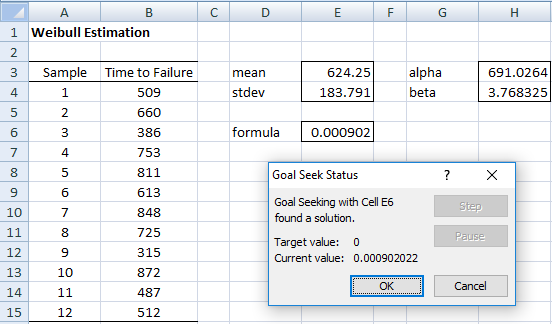
Figure 2 – Fit for a Weibull distribution
We see from Figure 2, that the fit for the data is a Weibull distribution with parameters α = 691.0264 and β = 3.7683.
Examples Workbook
Click here to download the Excel workbook with the examples described on this webpage.
References
Garcia, O. (1981) Simplified method-of-moments estimation of the Weibull distribution
https://www.scionresearch.com/__data/assets/pdf_file/0003/59286/NZJFS1131981GARCIA304-306.pdf
Lei, Y. (2008) Evaluation of three methods for estimating the Weibull distribution parameters of Chinese pine (Pinus tabulaeformis)
https://www.agriculturejournals.cz/publicFiles/68_2008-JFS.pdf
Hi Charles,
Would there be significant difference between the alpha and beta values of the Weibull parameters when using regression and method of moments?
Thank you again.
Hi Vinodh,
The estimates are usually pretty similar, which is a better estimate depends on the criteria you use. E.g. if your criterion is smallest MSE, then by definition the MLE approach is best. If smallest difference between actual mean and standard deviation and the theoretical values, then the method of moments is best. I haven’t tried to compare the method of moments with regression approaches.
Charles
Thank you for the explanation which I have been able to implement sucessfully. In the formulae, I think alfa and beta should be swapped using the regular convention: alfa= shape, beta= scale.
Hello Hans,
I have seen various inconsistent notations. E.g. in the following beta is the shape parameter.
https://www.weibull.com/hotwire/issue14/relbasics14.htm
Charles
Dear Carles,
Thank you for explanation, really appreciate your explanation. As I know, weibull can predicted lifetime of machine/robot until failure.
Question:
If I have 500 robots and 12 was failure at the time as your explain. How we calculate estimation failure in future with weibull? For example answer is 5% of 500 robots will failure at 667.
Thanks.
Hello,
The Weibull distribution uses two parameters. If you have reasonable estimates for these parameters, then you can estimate the failure rate at a future timeframe. I believe that the only information that you have is that at some point in time 12 out of 500 robots fail. Perhaps I am missing something, but I doubt that there is enough information to be able to estimate the two parameters.
Charles
Dear Charles,
I am very grateful for your initiative and didactic.
I searched in many papers with this issue and not understand.
Your instruction with example was very clear.
Congratulation and Thanks!
Dear Thomaz,
Glad I could help. Thank you for your comment.
Charles
Charles,
Would you please explain what formula are you using to get 0.000902022 (E6) second screenshot? everything else makes sense but I can not get that value therefore I can not find Beta.
Walter,
This is calculated by Goal Seek using some internal algorithm. Essentially Goal Seek is trying to find the value of x such that f(x) = a for some constant a and some function f.
Charles
Charles,
Thank you for your response. I am simulating your example…what I am looking for is what values are used to feed the equation to get 0.000902022. I have tried initially beta=0.5 and it gives me the first formula result= 1.70863 (first screen shoot) but I can not find the figures you have used to obtain the second formula result
Walter,
You need to make sure that cells H3 and E6 contain formulas and not just values.
The formula in cell H3 is =E3/EXP(GAMMALN(1+1/H4))
The formula in cell E6 is =GAMMALN(1+2/H4)-2*GAMMALN(1+1/H4)-LN(E3^2+E4^2)+2*LN(E3)
Charles
Charles,
Thank you again for your kind response. I did use the formula in that exact same order but still I don’t get that value of 0.00902. Not sure what I am doing wrong…
Walter,
What value do you get?
Charles
Charles,
I appreciate your time in this matter…
when I type this formula: =GAMMALN(1+2/0.5)-2*GAMMALN(1+1/0.5)-LN(E3^2+E4^2)+2*LN(E3)…I get the exact the same value shown in your example; formula: 1.70863 (E6) Figure 1. Of course, I am using H4=0.5 as suggested.
From here, If I type same formula again, what is the value H4 (you are using) to obtain the formula: 0.000902022 (E6) Figure 2?…
I have tried the Goal seek with this value and yes I get the Beta value = 3.768325.
Again my problem is how to get that formula (E6) in figure 2?
Walter,
Figure 1 and Figure 2 have the same formulas. There is only one spreadsheet. Figure 1 shows the situation before you use Goal Seek and Figure 2 shows the result after using Goal Seek. Cells E3, E4, E5 and H3 contain a formula. Cell H4 starts with the constant .5, whose value changes vby Goal Seek. I just tried using Goal Seek and it does yield the value .000902… in cell E6 (i.e. a value close to zero).
Charles
Hi Charles, Is it Gamma Ln or Ln Gamma ?
Hello Vinodh,
It is Ln(Gamma(x)), but the Excel function name for this is GAMMALN(x)
Charles
hi charles,
first of all very beautifully explained. thank you for this and next it would be very kind of you if you guide me in estimating Weibull distribution with 3 parameters and calculate 3rd that is location parameter.
thank you
Thank you for your kind remarks about the website.
Regarding estimating a 3-parameter Weibull distribution, see
https://www.researchgate.net/publication/224385814_Fitting_the_Three-Parameter_Weibull_Distribution_Review_and_Evaluation_of_Existing_and_New_Methods
Charles
Hi Charles,
I have been working on the reliability of electronics products for quite some time and your references have been a real help.
Currently, I intend to predict the failure of 1000 electronics units whose MTBF is 250000 hours every year? I used the Annualized failure rate method where the failure rate is about 4% or about 40 units per year. Is that the current understanding?
1-exp(-8766/250000). Please let me know what went wrong? Should I choose Weibull? If yes, 1p, 2p or 3p and how? I could really use your help on this one.
Can you please guide?
I am not familiar with the annualized failure rate method.
When you say that you “intend to predict the failure of 1000 electronics units whose MTBF is 250000 hours every year”, do you mean that you what to know the mean number of units that will fail each year for, say, the next 10 years?
Since there are 365 x 24 = 8,760 hours in a year, the MTBF for a unit can’t be 250000 hours each year. If the MTBF is 250000, then the mean time between failures is 28.54 years. Please clarify.
CHarles
thank u DR. for the good explaination
what should i calculate first after i have mean & Stdev?.
Adam,
The procedure described on this webpage will next calculate the alpha and beta parameter values for the Weibull distribution that best fits your data based on the method of moments.
Charles
Hello Charles, i have another question. My data has (x): 0,2,4,6,8,10 and (y):100;68;55.20;45.3;18.23;7.55
How do i get the number of iterations to put in the Weibull Data fitting tools? In fact what is number of iterations?
Elliot,
The estimation techniques that are described fit a Weibull distribution to a series of failure times, i.e. you would have only x values. What do the x and y values represent?
Charles
This method still needs a first estimate for the value of beta. There are also methods to calculate both alpha and beta from the moments, without the use of an iterative procedure. One such method that I came across is called the “power density” method. It works for wind speed distributions and uses the mean value of v^3. There is an “empirical” constant 3.69 in the formula. (Source: ASSESSMENT OF DIFFERENT METHODS USED TO ESTIMATE WEIBULL DISTRIBUTION PARAMETERS FOR WIND SPEED IN ZAFARANA WIND FARM, SUEZ GULF, EGYPT, H. Saleh *, A. S. Abou El-Azm** and S. Abdel-Hady, Proceedings of the 15th Int. AMME Conference, 29-31 May, 2012, equation 22, 23 and 24).
Jens,
Thanks for sharing this.
Charles
hello Charles. thanks for sharing this. I am trying to follow your guides so that i can do my calculations. It is my very first time to do Weilbul dbn analysis so my questions might sound silly.
1. May you help me clarify on [This is implemented in Excel via the formula =E3/EXP(GAMMALN(1+1/H4)) in cell H3]. In this formula we have EXP; how do we punch that in excel. i tried the exponetial function ^; i tried the power of 10, but i cant get the same answer as in this example. How do we punch EXP, which operation sign is that?
Thanks in advance.
Elliot,
EXP(x) is not the power function x^y. It is a function that returns the exponential of x. See
Exponentials and Logs
In Excel you use the worksheet function EXP(x).
Charles
Another question, Charles, with my data (x): 0,2,4,6,8,10 and (y):100;68;55.20;45.3;18.23;7.55
Being a one parameter data, which option do I pick between the newtons and solver method for the logistics distribution? also, if I choose Newtons which need # of iterations, how do I get the number of iterations?
Elliot,
Newton’s method and Solver should give similar results. Generally, Newton’s method is more accurate. You should use the number of iterations sufficient for convergence. This is the value such that if you add one or more iterations the result doesn’t change (or changes by a very small amount).
Charles
Hi,
I have found your desciption most illuminating and it has given me the insight to implement my own version in Julia using JuMP.
When it comes to plotting the function in Excel, note that
Excel’s Weibull.DIST reverses the meaning of Alpha and Beta
Another wonderfully clear and useful article; thanks so much.
How come the excel equation for alpha shows as E3/EXP(GAMMALN(1+1/H4))
whereas the equation for alpha doesn’t include the exponential? Which one is correct?
Joe,
GAMMALN calculates the natural log (LN) of the gamma function, not the gamma function itself. E.g. GAMMALN(x) = LN(GAMMA(x)). The inverse of the natural log function is the exponential function (thus =EXP(LN(x)) has the same value as x), Thus, to calculate the gamma function of x, you can use =GAMMA(x) or =EXP(GAMMALN(x)), since EXP(GAMMALN(x)) = EXP(LN(GAMMA(x))) = GAMMA(x).
You might then ask, why not simply use GAMMA(x) instead of GAMMALN(x)? There are two reasons for this: (1) older versions of Excel don’t provide a function GAMMA, only GAMMALN and (2) even for relatively small values of x, the value of GAMMA(x) can be huge and so an error will result; e.g. =GAMMA(172) yields the error value #NUM!, while =GAMMALN(172) yields the value 711.7147.
The first of these reasons is valid for the formula =E3/EXP(GAMMALN(1+1/H7)), but not the second.
Charles
Dear Charles,
I see. Understood. Now I can see the LN in the GAMMALN function! Thank you very much for your kind and clear explanation.
Dear Charles,
By the way, I have successfully determined the Weibull parameters using MLE, MME and Regression thanks to your tutorials. Is there any link or possibly let me know how to find the 95% confidence interval using these methods to show on the excel graph please?
Thanks,
Joe
Joe,
This is an excellent question. I don’t have a formula to give you for calculating a confidence interval for each parameter. My best advice is to use some sort of bootstrap approach (i.e. simulation approach) to create an estimate of the confidence intervals.
Charles
Hi Charles,
thank you for the useful tools you have here.
I am now working on the reliability calculator judgement so that I don’t have to use the stats software (e.g. Minitab) to find the alpha & beta value for my decisions.
When comparing the results in excel versus weibull graph plotted in minitab, I found out that the mean, stdev, alpha & beta are not tally.
can you feedback or suggest what I need to do please?
Syafiq,
If you send me an Excel file with your data and the results of your analysis, as well as the corresponding output from Minitab, I will try to figure out what is happening.
Charles
This is a great help! Thank you so much for sharing.
Hello,
Can you tell me please how you get this parameters “alpha” and “beta”
Thank you for your help.
Lydie.
See https://real-statistics.com/other-key-distributions/weibull-distribution/
Charles
Hi, if my datas consist of left truncated and right censored, how should i apply the formula ? Thanks
Xiao,
I would need more detail about the specific situation before I could answer.
Charles
My data is about lifetime of truck , 200 trucks by 2 manufacturers
Date of purchase Date of repair
my study period is three years, each date of purchase and repair is different, so some of the data have either right censored (date of repair is after end of study date) or left truncated (date of purchase is less than start of study period )
Then i need to use method of moment and MLE to estimate the parameter and fitting into 3 distributions (gamma, weibull and normal), but i don’t know how to deal with the censored and truncated data when doing MOM and MLE in excel.
Thanks
Xiao,
I don’t have a quick answer as to how to deal with censored and truncated data either.
I would likely have to use the WEIBULL.DIST function and not simply the mean and variance values.
I have some ideas how this may be done, but don’t have time to work on such a problem.
Charles
Dear Charlies
First of all , I want to say thank you that these articles about Weibull distribution really help me a lot! However, I notice that there is a 3-parameter Weibull distribution and I’m not quite sure wether it can be estimated by your approaches or not.
Glad to read that you appreciate the articles about the Weibull distribution.
Similar approaches can be used to estimate the parameters for the 3-parameter Weibull distribution.
Charles
Hi, Charles very interesting and usefull..
I have a question (Maybe a silly one)…
Why the constant 0.083129?
Thanks
O sorry I just see the thing erase my question please
Jose,
No one erased your question. It just hadn’t been posted yet.
Charles
Jose,
Not a silly question at all.
This value is just the value of the right side of the equation that resulted from the elimination of alpha, namely ln(s^2 + m^2) – 2*ln(m) where m = mean of the x values. This term evaluates to the constant .083129 (all these values are known).
I have just changed this webpage to make things clearer (at least I hope that it is clearer). This time I put all the terms on the left side of the equation and set the result equal to zero. It is really the same as before, except that the constant term this time is zero.
Charles