Basic Concepts (initial approach)
Given a collection of data that may fit the Pareto distribution, we would like to estimate the parameters that best fit the data. We illustrate the method of moments approach on this webpage.
As shown in Pareto Distribution, we can estimate the sample mean and variance for the beta distribution by the population mean and variance for α > 2 as follows:
Solving for m
Equating the two expressions for m and dividing by α–1, we get
It now follows that
Solving for α, we get
Since α > 2, it follows that
Caution: The above analysis is only valid provided all the data elements in the sample are greater than or equal to m.
Examples
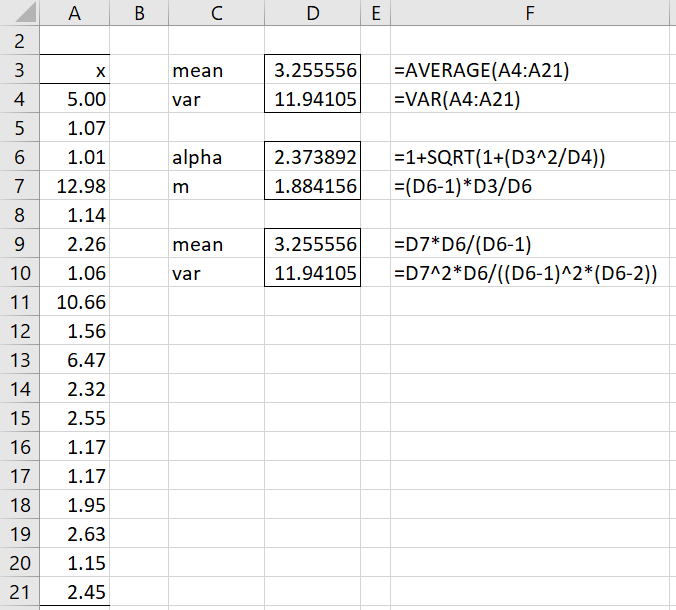
Example 1: Determine the parameter values for fitting the data in range A4:A21 of Figure 1 to a Pareto distribution.
We see from the right side of Figure 1 that α = 2.373892 and m = 1.884156. Note too that if we calculate the mean and variance from these parameter values (cells D9 and D10), we get the sample mean and variances (cells D3 and D4).
Figure 1 – Fit for a Pareto Distribution
Although the estimated value of alpha is larger than 2, there are some data elements (column A) that are less than the estimated value of m. This means that this analysis is not valid.
Basic Concepts (revised approach)
We, therefore, need to simplify the method of moments by setting
and estimating the value of alpha based on
Solving for alpha, we get

Revised Solution
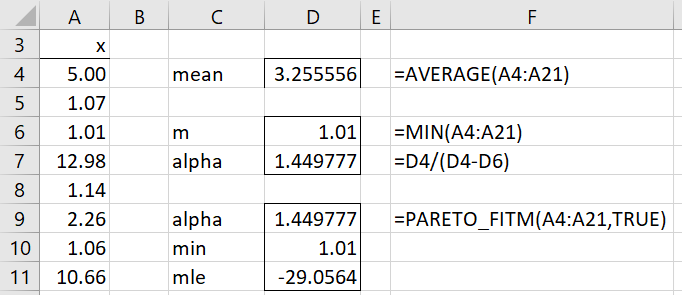
The revised solution for Example 1 is shown in Figure 2 (only the first 8 data elements are shown).
Figure 2 – Revised Fit
We see from the right side of Figure 2 that α = 1.44977 and m = 1.01. Since the estimated value of alpha is larger than 1, this approach is valid. Note, however, that since α ≤ 2, the variance is undefined (or is considered to be infinite).
We also show the estimation using the PARETO_FITM function, as described in Real Statistics Support for Method of Moments.
Examples Workbook
Click here to download the Excel workbook with the examples described on this webpage.
Reference
Wikipedia (2021) Pareto distribution
https://en.wikipedia.org/wiki/Pareto_distribution


Hello Charles,
I do not understand the result ‘mle’ in the Figure 2.
If you are applying the method of moments for the Pareto parameter estimation, how you can calculate a maximum log-likelihood ?
Thank you!
Hello Nur,
You are correct. I am simply calculating the log-likelihood for the method of moments technique. It is only the “maximum” log-likelihood based on the method of moments.
Charles
when I calculate th alpha and m and use them to generate the PDF it produces numbers greater than one and so how can it be a PDF? On the other hand the cumulative probability series looks perfectly OK.
Hi Gerald,
The pdf can be greater than 1. For example, see the graph of the pdf at
https://www.real-statistics.com/other-key-distributions/pareto-distribution/
Charles
Thank you I have appreciated your work for many years.