Given a collection of data that may fit the negative binomial distribution, we would like to estimate the parameters which best fit the data. We illustrate the maximum likelihood (MLE) method on this webpage. Click here to see another approach, using the method of moments.
Log-likelihood function
The likelihood function for the negative binomial distribution is
It follows that the log-likelihood function is
Our goal is to determine the values of the k and p parameters that maximize LL.
Maximizing LL
As usual, to find a (local) maximum value, we set the partial derivatives of LL with respect to k and p to zero.
Solving for p, we get
which is the same estimate we obtain from the method of moments. We now look at the partial derivative with respect to k.
Substituting the formula for p found above, we get the following equation just in k.
Here, ψ is the polygamma function described in Fitting Gamma Distribution Parameters via MLE.
We can solve this equation using Newton’s method or some other iterative approach. For our purposes, we will use Excel’s Solver or Excel’s Goal Seek, as illustrated by the following example.
Example
Example 1: Repeat Example 1 of Method of Moments: Negative Binomial Distribution using the maximum likelihood method. The data is repeated on the left side of Figure 1.
Figure 1 – MLE fit example
Here, cell H3 contains the formula =COUNT(B3:E7), cell H4 contains =AVERAGE(B3:E7), and cell H7 contains the formula =H5/(H4+H5). Cell H6 contains the formula
=SUM(MAP($B3:$E7,LAMBDA(x,POLYGAMMA(x+H5))))-H3*POLYGAMMA(H5)+H3*LN(H5/(H4+H5))
Here we are using Real Statistics’ POLYGAMMA function. We are also using Excel’s LAMBDA function, available for Excel 365 users. For other users, the following substitute formula can be used based on Real Statistics Lambda capabilities.
=SUMPRODUCT(MAPS(B3:E7,”POLYGAMMA($x+H5)”))-H3*POLYGAMMA(H5)+H3*LN(H5/(H4+H5))
Finally, cell H8 contains the formula
=SUMPRODUCT(GAMMALN($B3:$E7+H5))-SUMPRODUCT(LN(FACT($B3:$E7)))-H3*GAMMALN(H5)+H3*H5*LN(H7)+LN(1-H7)*SUM($B3:$E7)
Solver solution
The value in cell H6 contains the optimized value for k using Solver. We obtain this value by filling in the Solver dialog box as shown in Figure 2 (and also unchecking the Make Unconstrained Variables Non-Negative option).
Figure 2 – Solver dialog box (upper portion displayed)
We obtain the same result by setting the Set Objective field to H8 and using the Max option.
Goal Seek solution
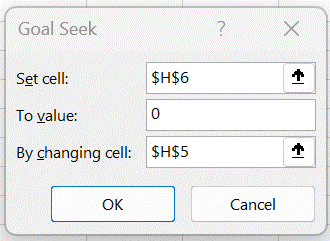
We can obtain a similar result for k by using Excel’s Goal Seek capability. We fill in the Goal Seek dialog box as shown in Figure 3 and obtain a value of k = 12.76756.
Figure 3 – Goal Seek dialog box
Final observations
If we restrict k to an integer value then 12 and 13 are the logical choices. We see from Figure 1 that k = 13 yields a larger LL value, and so we settle on k = 13.
Examples Workbook
Click here to download the Excel workbook with the examples described on this webpage.
Reference
Wikipedia (2023) Negative binomial distribution
https://en.wikipedia.org/wiki/Negative_binomial_distribution
Millard, S. P. (2023) Estimate probability parameter of a negative binomial distribution
https://search.r-project.org/CRAN/refmans/EnvStats/html/enbinom.html


