Basic Concepts
The log-likelihood function for the Laplace distribution for the sample {x1, …, xn} is
The maximum likelihood estimates are
where x-tilde is the median of the sample and n is the sample size. In this case
![]()
![]()
Example
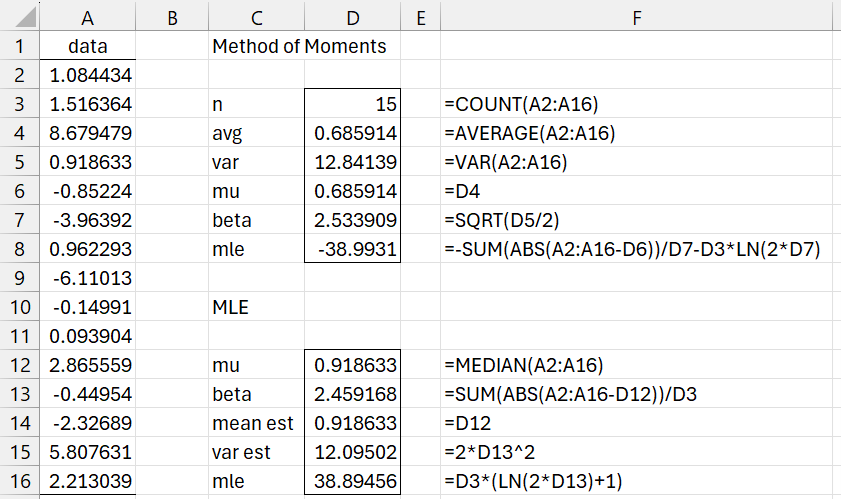
Example 1: Estimate the mu and beta parameters for a Laplace distribution that best fits the data in range A2:A16 of Figure 1. Use both the method of moments and MLE.
Figure 1 – Fitting a Laplace distribution
Examples Workbook
Click here to download the Excel workbook with the examples described on this webpage.
Reference
Stack Exchange (2017) Maximum likelihood estimator of Laplace distribution
https://math.stackexchange.com/questions/2243898/maximum-likelihood-estimator-of-laplace-distribution
Godfrey, A. J. R., Wu, H., Pirikahu, S. (2020) The Laplace distribution. R documentation
https://search.r-project.org/CRAN/refmans/ExtDist/html/Laplace.html
