Basic Concepts
We show how to estimate the parameters of the gamma distribution using the maximum likelihood approach. The pdf of the gamma distribution is

It turns out that the maximum of L(α, β) occurs when β = x̄ / α. We can now use Excel’s Solver to find the value of α that maximizes LL. Alternatively, we can use the following iteration method to find α.
![]()
where ψ(z) (also denoted ψ0(z)) is the digamma function and ψ1(z) is the trigamma function. These functions can be estimated as follows:
![]()
The estimates are quite accurate for values of z ≥ 4. For smaller values of z, we can improve the estimates by using the following properties:
![]()
Worksheet Function
Real Statistics Function: The digamma and trigamma functions can be computed via the following Real Statistic worksheet function:
POLYGAMMA(z, k) = digamma function at z if k = 0 (default) and trigamma function at z if k = 1.
Example
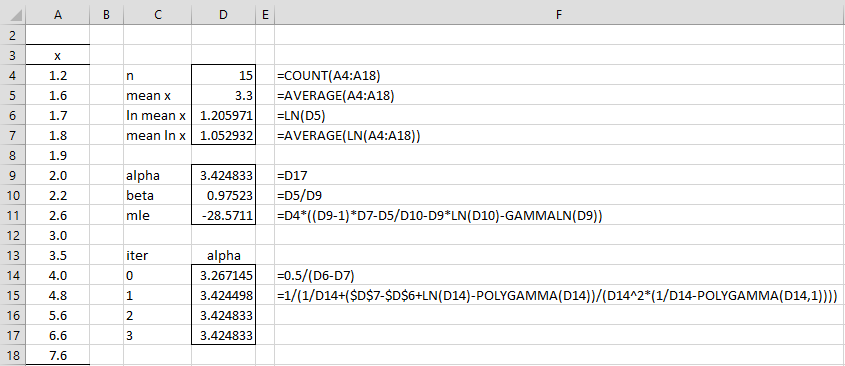
Example 1: Find the parameters of the gamma distribution that best fit the data in range A4:A18 of Figure 1.
The preliminary calculations are shown in range D4:D7 of Figure 1. Note that the formula in cell D7 is an array function (and so you must press Ctrl-Shft-Enter and not just Enter, unless you are using Excel 365). The iteration is shown in the range D14:D17. As you can see, the iteration converges quite rapidly.
Figure 1 – Fitting a Gamma Distribution
The alpha and beta parameters are 3.425 (cell D9) and 0.975 (cell D10).
Examples Workbook
Click here to download the Excel workbook with the examples described on this webpage.
References
Wikipedia (2017) Digamma function
https://en.wikipedia.org/wiki/Digamma_function
Wikipedia (2017) Trigamma function
https://en.wikipedia.org/wiki/Trigamma_function


Hi Charles,
In the dataset above the expectation calculated using the alpha and beta parameter of Gamma distribution is the same as taking the average of the data set ( i.e., using normal distribution) ?
3.34 is the answer we get in both the cases.
Is this always the case ?
Hello Vinodh,
I don’t see 3.34 in the example you are referencing. I also don’t know what you mean by “the average of the data using the normal distribution”.
I know that the mean of the sample is approximately equal to alpha x beta. This could account for what you are referring to.
Charles
here is the pseudo code. thank u mr charles
function psi(z,k)
if z>=4 then
if k=0 then
psi = //digamma series
exit function
elseif k=1 then
psi = //trigamma
` endif
else
psi = psi(z+1,k) – 1/z
end if
end function
Dear Charles,
You said that if “z < 4, then you need to use the following iterative approach: https://i2.wp.com/www.real-statistics.com/wp-content/uploads/2017/06/image321c.png". In example 1, z (alpha) is less than 4 but pollygamma has used the formulas described in https://i2.wp.com/www.real-statistics.com/wp-content/uploads/2017/06/image319c.png
https://i0.wp.com/www.real-statistics.com/wp-content/uploads/2017/06/image320c.png, correct?
Rafael,
Yes, this is correct and the Real Statistics POLYGAMMA function handles all of this. Keep in mind that when z < 4, the formulas used (perhaps multiple times) bring the value of z to a value >= 4 where the other two formulas can be used.
Charles
Dear Charles,
Thanks for the answer.
Hey Charles!
Thanks for your valuable contribution. Can you provide me with the codes to create the digamma and trigamma functions? I didnt understudy how to make them.
Thanks
Antonio
Antonio,
As shown on the webpage, if z >= 4 then just use the following formulas, using as many terms as necessary to obtain the desired accuracy:
https://i2.wp.com/www.real-statistics.com/wp-content/uploads/2017/06/image319c.png
https://i0.wp.com/www.real-statistics.com/wp-content/uploads/2017/06/image320c.png
If z < 4, then you need to use the following iterative approach: https://i2.wp.com/www.real-statistics.com/wp-content/uploads/2017/06/image321c.png
Charles
Hi charles,
What formula do I have to put in my VBA? I don’t get it how ‘polygamma’ can be determined.
Hope you can help me.
Gr. Jonathan
Hi Jonathan,
The formulas for polygamma when k = 1 (digamma) and k = 2 (trigamma) are shown on this webpage. These are infinite sums, but you only need to use asmall number of the terms.
Charles
This is great!
If I understand correctly, you provided a method to estimate the shape and scale parameters for the gamma distribution. I was wondering, how would we estimate the rate (1/scale) parameter instead if that was our data?
Thanks for your help.
David,
Based on your definition of the rate parameter it should be the reciprocal of the estimated scale parameter.
Charles
Very helpful instruction that was easily implemented in Excel. THANK-YOU!
Two comments:
1. The nested formula for “mean ln x” imbeds a range in the ln function. This should be noted as an array formula (enter with CTRL SHIFT ENTER). If a simple ENTER is used, then the calculation of “mean ln x” is incorrect.
2. POLYGAMMA function can be created as a user-defined function (UDF) using VBA. The given formulas (series expansions for z>4 and recursive relations for z<4) helped. But I had to look up the values for trigamma and digamma for 0<z<=1 and include these in my UDF for interpolating values in that range. This was critical to do correctly because the recursion relations start with decimal values of z if z is not an integer.
Cal,
I am pleased that the website has been helpful to your implementation.
1. Thanks for identifying this omission. I have added this information to the webpage.
2. I didn’t think that it was necessary to lookup values of digamma and trigamma for 0 < z <= 1. E.g. to calculate the digamma value at z = .2, you should be able to calculate the value psi(4.2) and then use the formula psi(z) = psi(z+1) - 1/z several times to get the value of psi(.2). psi(4.2) can be calculated as ln(4.2) - 1/(2*4.2) - 1/(12*4.2^2) + etc. psi(.2) = psi(1.2) - 1/.2 and psi(1.2) = psi(2.2) - 1/1.2 and psi(2.2) = psi(3.2) - 1/2.2 and psi(3.2) = psi(4.2) - 1/3.2. Thus once psi(4.2) is calculated, you should be able to calculate psi(.2). Thus z doesn't have to be an integer. Charles