Method of Moments
The binomial distribution is characterized by the m and p parameters, where m = the number of trials and p = the probability of success in one trial. We assume that m is fixed. Since the mean of the distribution is mp, given m trials, we can estimate p by p = x̄/m.
Log-likelihood
We assume that we have n samples, x1, .., xn, where each xi is an integer between 0 and m, representing the number of successes in m trials. The likelihood function can be expressed as
Thus, we can express the log-likelihood function by
Note that we can compute ln C(m, xi) by using the Excel formula =LN(COMBIN(m, xi)) or the Real Statistics function =LNCOMBIN(m, xi). The latter is better for large values of m.
Maximum Log-likelihood Estimate
It turns out that LL is maximized when p = x̄/m. This is the same estimate provided by the method of moments.
For those of you familiar with calculus, we prove this by setting the derivative of LL with respect to p to zero, as follows:
Thus
Example
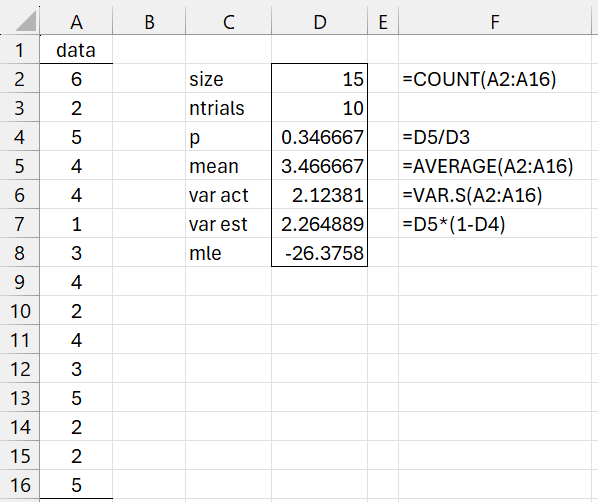
Example 1: Estimate the p parameter for the binomial distribution that best fits the data in column A of Figure 1. Here, the data represents the number of successes in 10 trials for 15 samples.
Figure 1 – Fitting a binomial distribution
Cell D8 contains the formula:
=SUMPRODUCT(LN(COMBIN(D3,A2:A16)))+D2*(LN(D4)-LN(1-D4))*D5+D2*D3*LN(1-D4)
Examples Workbook
Click here to download the Excel workbook with the examples described on this webpage.
References
Rotella, J. (2024) Binomial likelihood
https://www.montana.edu/rotella/documents/502/binom_like.pdf
Stack Exchange (2018) Maximum likelihood estimation of p in a binomial sample
https://stats.stackexchange.com/questions/149202/maximum-likelihood-estimation-of-p-in-a-binomial-sample


