Data Analysis Tool
The Real Statistics Resource Pack provides a Taguchi data analysis tool to perform Taguchi DOE.
You can use this data analysis tool to address Example 1 of 2-level Taguchi Design by pressing Ctrl-m and choosing the Taguchi DOE option from the Anova tab. The dialog box shown in Figure 1 will now be displayed.
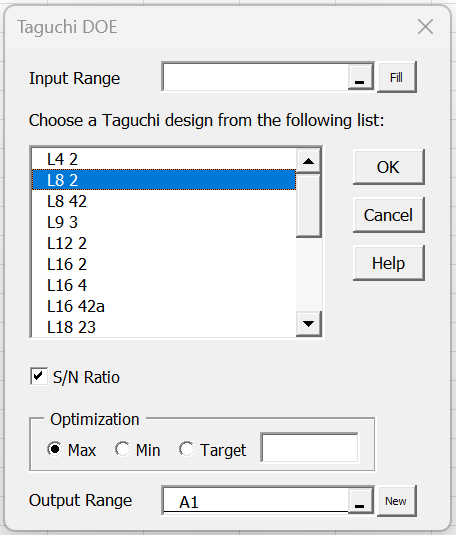
Figure 1 – Taguchi DOE dialog box
After double-clicking on the L8 2 option (or clicking on the OK button), the design shown in Figure 2 of 2-level Taguchi Design (except that ranges B2:H2 and I2:I10 won’t be filled in). You don’t need to fill in any other fields (in fact, these will be ignored as long as the Input Range is not filled in).
After filling in the values in range B2:H2 and I3:I10, you again press Ctrl-m, choose the Taguchi DOE option from the Anova tab, and then fill in the Input Range with the range A1:I10, uncheck the S/N Ratio field, select the Min field (“smaller is better”) and insert K1 into the Output Range.
Actually, you only need to insert A1:I1 in the Input Range since the rest of the design range will be filled in automatically.
After clicking on the OK button, the results shown in Figures 4, 5, and 7 of 2-level Taguchi Design will be displayed.
Worksheet Functions
Optimization
The Real Statistics Resource Pack provides the following worksheet function which outputs an array of the form shown in Figure 1 or 3 in Taguchi Design Optimization.
TOptimize(R1, R2, optcode, sn, opt_only)
Here R1 is an array or cell range with the results averages for all the factor/level combinations. R1 includes the row labels but not the column labels. For Example 1 of 2-level Taguchi Design, this is range K2:M7 of Figure 2 of Taguchi Design Optimization or Figure 4 of 2-level Taguchi Design.
R2 is a two-column array or cell range with a list of factors in the second column. Any factor with a non-blank entry in the corresponding entry in the first column is excluded from the output. Any interaction is also excluded from the output. If R2 is omitted, then the output will include all the main effects factors. For Example 1 of 2-level Taguchi Design, this is range P1:Q7 of Figure 4 of 2-level Taguchi Design.
optcode takes the value “max” (default) for biggest is best, “min” for smallest is best, or a numeric value which specifies the target (nominal case where closest to target is best).
sn = TRUE (default) if the S/N ratio is used (as explained at Signal-to-Noise Ratio) and FALSE if the average is used.
When opt_only = FALSE, then an array with the S/N or average results for all combinations of factor/level will be output for all main effects factors that have not been excluded. When opt_only = TRUE (default) then only the optimum combination is output.
Optimization Example
For Example 1 of 2-level Taguchi Design, the output shown in Figure 1 of Taguchi Design Optimization can be obtained using the formula
=TOptimize(K2:M7,P2:Q7,”min”,FALSE,FALSE)
while the output shown in Figure 3 of Taguchi Design Optimization can be obtained using the formula
=TOptimize(K2:M7,,”min”,FALSE,FALSE)
Interaction
The Real Statistics Resource Pack provides the TInteract worksheet function that simplifies the selection of the proper column for the interaction of two factors in the L4, L8, L16 and L32 designs.
TInteract(i, j) = the column where you should locate the interaction between main effects factors in columns i and j.
E.g. the formula =TInteract(7,10) outputs the value 13.
Note that the complete version of this function is TInteract(i, j, levels) where levels is the number of levels in the design with levels defaulting to 2. We will describe the full version of the function in Taguchi 3-level Designs.
Examples Workbook
Click here to download the Excel workbook with the examples described on this webpage.
References
Roy, R. K. (2010) A primer on Taguchi method. 2nd ed. Society of Manufacturing Engineers
https://www.scribd.com/document/381615601/288020391-a-Primer-on-the-Taguchi-Method
University of York (2004) Orthogonal arrays (Taguchi designs)
No longer available online
Minitab (2024) Catalogue of Taguchi designs
https://support.minitab.com/en-us/minitab/help-and-how-to/statistical-modeling/doe/supporting-topics/taguchi-designs/catalogue-of-taguchi-designs/