Optimization based on the most important factors
As described in 2-level Taguchi Design, B, C, and D are most important factors in the design for Example 1 of that webpage. Since there are 2 levels, there are 23 = 8 possible combinations of these three factors. These are shown in the first three columns of Figure 1.
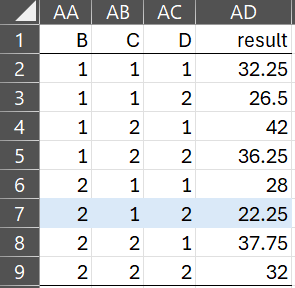
Figure 1 – Optimization
The noise level for each of these 8 combinations is shown in column AD. Each of these results is calculated using the table on the left side of Figure 4 of 2-Level Taguchi Design (which is replicated in Figure 2).
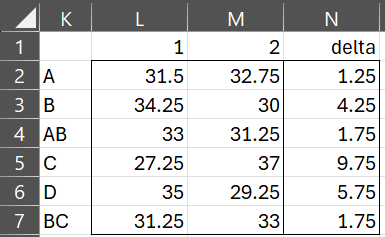
Figure 2 – Factor/Level Means
Calculation
The noise level for each combination is calculated as follows:
![]()
where i = 1 or 2. Here, M is the (group) mean of the all the result values in range L2:M7 of Figure 2, which is 32.125. This is also the mean of all the result values in column I of Figure 2 of 2-Level Taguchi Design.
B1 (cell L3 of Figure 2) is the mean of the result values in column I of Figure 2 of 2-Level Taguchi Design where the code in the column corresponding to B is 1. The other cells in Figure 2 are defined similarly.
E.g. the noise level for the 7th row in Figure 6 (i.e. B2C1D2) is
![]()
= 32.125 + (20 – 32.125) + (27.25 – 32.125) + (29.25 – 32.125) = 22.25
Since a lower level of noise is best, we look for the smallest value in AD of Figure 1 (highlighted in light blue). This corresponds to the B2C1D2 combination.
Optimization using all factors
If we include all four main effects factors, we obtain the results shown in Figure 3.
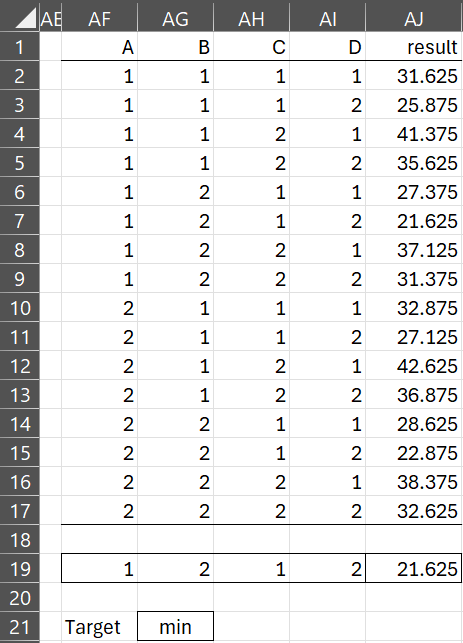
Figure 3 – Optimization (all factors)
Here cell AJ19 contains the formula =MIN(AJ2:AJ17). Cell AF19 contains the formula =INDEX(AF2:AF17,MATCH($AJ19,$AJ2:$AJ17,0)). You can fill in the other entries in row 19 by highlighting AF19:AI19 and pressing Ctrl-R.
Note that this analysis identifies the optimal combination, namely A1B2C1D2 even though this combination is not one of the 7 combinations used in the experiments shown in Figure 2.
Examples Workbook
Click here to download the Excel workbook with the examples described on this webpage.
References
Roy, R. K. (2010) A primer on Taguchi method. 2nd ed. Society of Manufacturing Engineers
https://www.scribd.com/document/381615601/288020391-a-Primer-on-the-Taguchi-Method
Minitab (2024) Catalogue of Taguchi designs
https://support.minitab.com/en-us/minitab/help-and-how-to/statistical-modeling/doe/supporting-topics/taguchi-designs/catalogue-of-taguchi-designs/