Objective
Often a key objective of a Taguchi design is to make the production of a product more robust to variation. One way to measure this is by using the signal-to-noise ratio. This approach is especially useful when multiple measurements are made for the same experiment (i.e. when replication is cost-effective). The greater the S/N ratio the smaller the product variance around the target value, and so we want our design to maximize the S/N ratio.
We use one of three goals in our designs:
- Bigger is better
- Smaller is better
- Closer to the target is better (aka nominal)
For Example 1 of 2-level Taguchi Design, we used “smaller is better”.
Formulas
For each trial in our experiment, we first calculate the mean-square deviation (MSD) from our target (for this trial). Assuming we have n replications for each trial in the experiment with values y1, …, yn, we define MSD as shown in Figure 1:
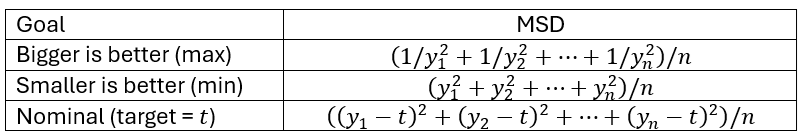
Figure 1 – MSD formulas
We then define the S/N Ratio by
S/N = -10⋅log10(MSD)
Then we can express the MSD in terms of the S/N ratio by
![]()
Note too that if we define the expected value of a trial to be
![]()
then the expected value of a trial can also be expressed in terms of the S/N ratio.
When you have replications, it is usually better to use the S/N Ratio instead of the mean (as was done in Example 1 of Taguchi Designs with Replications).
Example using the S/N ratio
Example 1: Repeat Example 1 of Taguchi Designs with Replications using the S/N Ratio.
The approach is the same as for Example 1 from that web page except that this time we check the S/N Ratio option on the dialog box shown in Figure 1 of Taguchi DOE Data Analysis Tool. The output is similar to that shown in Figures 2. 3, and 4 of Taguchi Designs with Replications, except that instead of a column of means in range M3:M10 of Figure 2 from that web page, we use a column of S/N ratios, as shown in Figure 2 below.
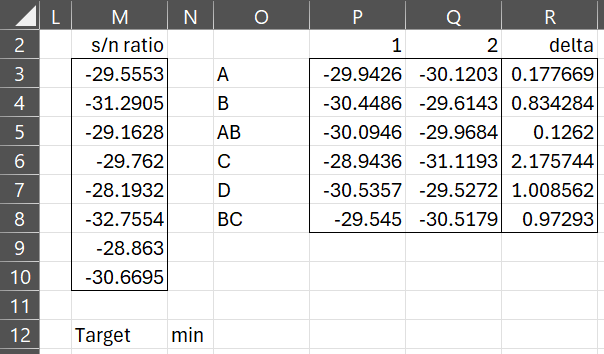
Figure 2 – Analysis using S/N Ratio (part 1)
The S/N Ratios are calculated as described above. E.g. cell M3 contains the formula
=-10*LOG10(SUMSQ(I3:K3)/COUNT(I3:K3))
The rest of the output is shown in Figures 3 and 4.
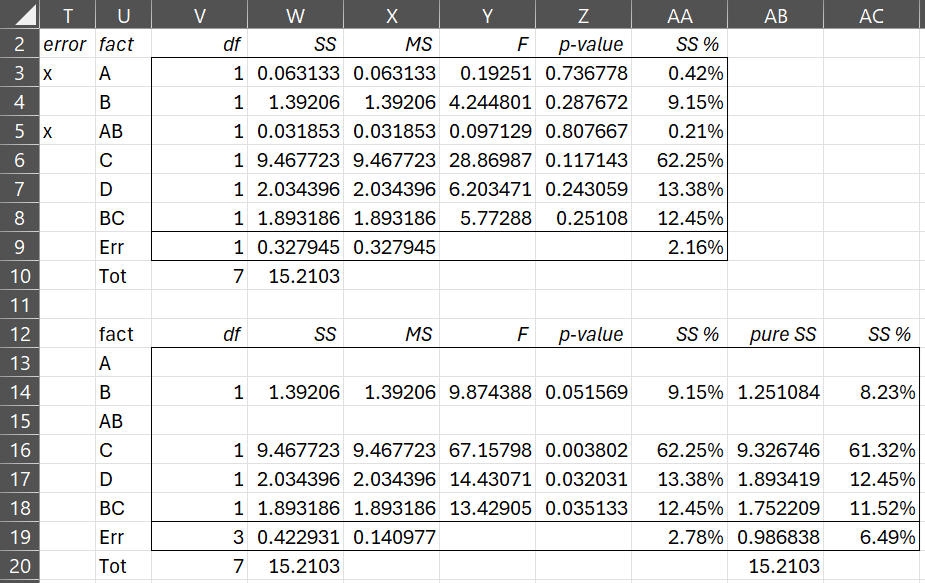
Figure 3 – Analysis using S/N Ratio (part 2)
When using the S/N Ratio, we don’t make the modifications described for replications (in Example 1 of Taguchi Designs with Replications), namely the ANOVA table is created based on the data in column M of Figure 2 as if there were no replications.
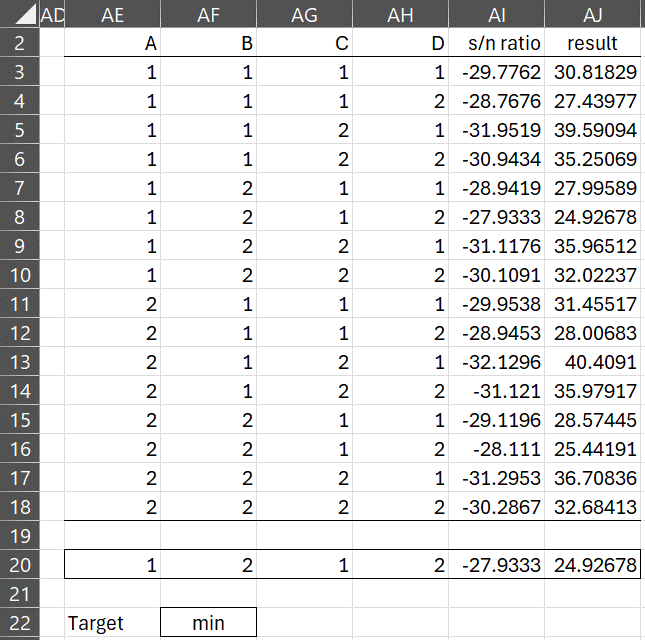
Figure 4 – Analysis using S/N Ratio (part 3)
When using S/N Ratios, our goal is always to maximize the S/N Ratio, which for this example is -27.9333, as shown in row 8 of Figure 3. As we saw above, we can then estimate the corresponding result (in cell AJ8) via the formula =10^(-AI8/20). Alternatively, can select the minimum value in column AJ.
Worksheet Function
As described in Real Statistics Support for Taguchi DOE, the Real Statistics Resource Pack provides the following worksheet function.
TOptimize(R1, R2, optcode, sn, opt_only)
We now provide a more complete description of this function,
Here R1 is an array or cell range with the results averages for all the factor/level combinations. R1 includes the row labels but not the column labels. For Example 1, this is range O3:Q8 of Figure 2.
R2 is a two-column array or cell range with a list of factors in the second column (such as range T3:U8 in Figure 3). Any factor with a non-blank entry in the corresponding entry in the first column is excluded from the output. Any interaction is also excluded from the output. If R2 is omitted, then the output will include all the main effects factors.
optcode takes the value “max” (default) for biggest is best, “min” for smallest is best, or a numeric value which specifies the target (nominal case where closest to target is best).
sn = TRUE (default) if the S/N ratio is used and FALSE if the average is used.
When opt_only = FALSE, then an array with the S/N or average results for all combinations of factor/level will be output for all main effects factors that have not been excluded. When opt_only = TRUE (default) then only the optimum combination is output.
Output
You can obtain output similar to that shown in Figure 4 by using the array formula
=TOptimize(O3:Q8,,”min”,,FALSE)
If you only want the optimum combination for all main effects factors in Example 1 then you can use the array formula =TOptimize(O3:Q8,,”min”). This produces the output shown in range AL2:AQ3 of Figure 5.
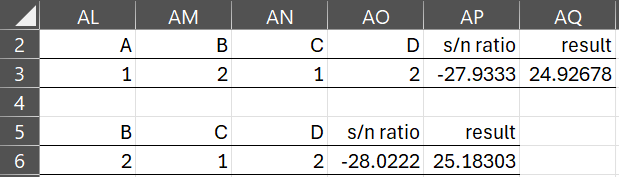
Figure 5 – TOptimize optimized results only
Range AL5:AP6 contains the optimized results restricted to the non-excluded factors using the array formula =TOptimize(O3:Q8,T3:U8,”min”).
Examples Workbook
Click here to download the Excel workbook with the examples described on this webpage.
References
Roy, R. K. (2010) A primer on Taguchi method. 2nd ed. Society of Manufacturing Engineers
https://www.scribd.com/document/381615601/288020391-a-Primer-on-the-Taguchi-Method
University of York (2004) Orthogonal arrays (Taguchi designs)
No longer available online
Minitab (2024) Catalogue of Taguchi designs
https://support.minitab.com/en-us/minitab/help-and-how-to/statistical-modeling/doe/supporting-topics/taguchi-designs/catalogue-of-taguchi-designs/
Dear sir,
I have used taguchi method with L9 orthogonal array.
I need to maximize MRR, which is a functional of four factors pressure, cutting velocity, nozzle tip distance and nozzle diameter.
However, I am getting negative values of S/N ratio for each level and factors.
Please tell me if it is alright, or there is some mistake in my readings or method?
Hello Shivam,
If you email me an Excel spreadsheet with your data, I will try to figure out what is going wrong.
Charles
Ok sir.