As for Randomized Complete Block Design, described in Follow-up RCBD Testing, the Split-plot Anova data analysis tool provides support for two follow-up tests: Contrasts and Tukey HSD.
Contrasts
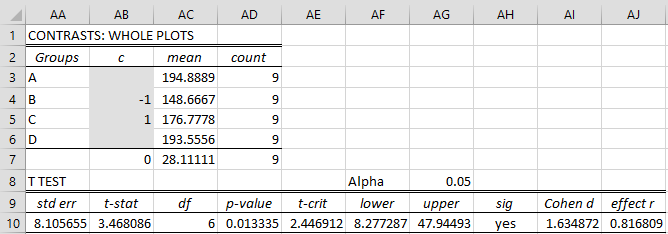
Example 1: As we see from Figure 3 (cell Y6) of Split-plot Tools, there is a significant difference between the whole plot factors (composition) in Example 1 of Split-plot Tools. Use contrasts to determine whether there is a significant difference between compositions B and C.
You can accomplish this analysis, by choosing the Split-plot Anova data analysis tool and checking the Contrasts Whole plot option on the dialog box as shown in Figure 2 of Split-plot Tools. After filling in the contrast coefficients in range AB3:AB6 of Figure 1, we get the following analysis.
Figure 1 – Whole plot contrasts
We see that there is a significant difference between the flexibility values for compositions B and C.
The formula for the standard error (cell AA10) is
=SQRT(V7*SUMPRODUCT(AB3:AB6^2,1/AD3:AD6))
This formula refers to the Whole Plot MSE (cell V5 in Figure 3 of Split-plot Tools). Similarly, the dfE (AC10) is calculated using the formula =U7.
We can also perform contrast analysis on subplots (see Figure 2) by choosing the Contrasts Sub-plots option on the Split-plots Anova dialog box (see Figure 2 of Split-plot Tools), although for Example 1 of Split-plot Tools this not necessary since as we have seen from Figure 3 of Split-plot Tools there is no significant difference between the flexibility values based on temperature.
Figure 2 – Subplot contrasts
Note that for the subplot contrasts, the worksheet formula for the df (cell AN9) and standard error (cell AL9) are =U10 and =SQRT(V10*SUMPRODUCT(AM3:AM5^2,1/AO3:AO5)). These formulas refer to the Subplot dfE and MSE (cell U10 and V10 in Figure 3 of Split-plot Tools).
Tukey’s HSD Whole Plots
Example 2: Use Tukey’s HSD to determine which pairs of compositions have a significant difference based on the data from Example 1 of Split-plot Tools.
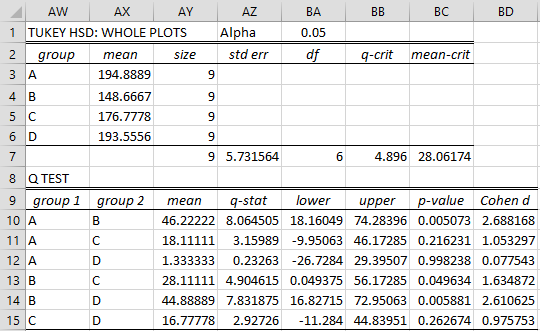
This time we choose Tukey Whole plots option on the dialog box as shown in Figure 2 of Split-plot Tools to obtain the analysis shown in Figure 3.
Figure 3 – Tukey’s HSD for whole plots
From Figure 3, we see that p-value = .049634 < .05 = α, and so there is a significant difference between compositions B and C, and therefore between A and B and between B and D (since the difference between their means is larger). We also see that there is not a significant difference between any of the other pairs of compositions.
As for whole plot contrasts, this analysis uses the MSE and dfE for the whole plots error term. E.g. cell AW10 contains the formula =SQRT(V7/AZ7) and cell AY contains the formula =U7.
Tukey’s HSD Sub-plots
We can also perform Tukey’s HSD for subplots by selecting the Tukey Sub-plot option, as shown in Figure 4.
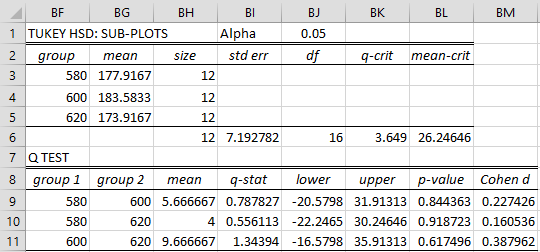
Figure 4 – Tukey’s HSD for sub-plots
Interactions
The Split-plot Anova data analysis tool doesn’t provide a way to perform contrasts of Tukey’s HSD on the interaction between the whole plot and sub-plot factors. Instead, we need to use the Randomized Complete Block ANOVA data analysis tool.
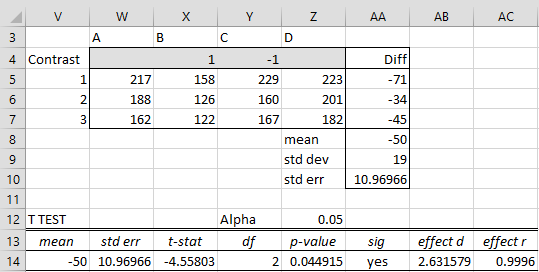
Example 4: Determine whether there is a significant difference between the flexibility of compositions B and C at 580 degrees based on the data in Example 1 of Split-plot Tools.
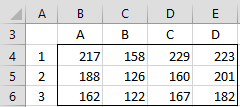
First, we need to eliminate the data for temperatures not equal to 580 degrees from Figure 1 of Split-plot Tools. This results in the data in Figure 5.
Figure 5 – Data at 580 degrees
We now use the Contrasts option for the Randomized Complete Block ANOVA data analysis tool based on the input data in range A3:E6 of Figure 5. Filling in the appropriate contrast coefficients in the output, we get the analysis shown in Figure 6.
Figure 6 – Interaction contrast
We see that the differences between the means is 50, which is significant (cell AA14).
Note that this result is significant despite the fact that the Whole plot × Subplot interaction is not significant (see cell Y9 of Figure 3 of Split-plot Tools).
Examples Workbook
Click here to download the Excel workbook with the examples described on this webpage.
References
Montgomery, D. C. (2012) Design and analysis of experiments. 8th ed. Wiley
https://faculty.ksu.edu.sa/sites/default/files/douglas_c._montgomery-design_and_analysis_of_experiments-wiley_2012_edition_8.pdf
Zhang, H. (2022) Split plot design
https://www.stat.purdue.edu/~zhanghao/STAT514/Lecture_Notes/LectureNotes20-Split-plot-Designs-.html#:~:text=A%20split%2Dplot%20design%20is,randomly%20assigned%20to%20split%2Dplots.

can you help how to acces split plot anova in excel ?, please
iam using microsoft office 2013
Umar,
Press Ctrl-m and select Split-Plot Anova from the Anova tab. The instructions are provided at
https://real-statistics.com/design-of-experiments/split-plot-design/split-plot-tools/
Charles