The various capabilities described on the Latin Square webpages, with the exception of the missing data analysis, can be accessed using the Latin Squares Real Statistics data analysis tool.
Example
For example, to perform the analysis in Example 1 of Latin Squares Design with Replication, press Crtl-m, choose the Analysis of Variance option and then select the Latin Squares option. You now fill in the dialog box that appears as shown in Figure 1.
Figure 1 – Latin Squares dialog box
Format Options
Four input formats are accepted. For Example 1 of Latin Squares with Replication with the data formatted as in Figure 1 of that webpage, we would use the Excel format with data to right of treatments option.
For Example 1 of Latin Squares Design with the data as in Figure 4 of that webpage we would use the Excel format with data below treatments option. This last option is only available for Latin Square design without replications. In either case, the row and column labels must be numbers 1, 2, …, r (where r = the number of treatments) and the treatment labels must be A, B, C, … until the rth capital Latin letter. The row and column headings can’t be omitted and there can be no missing data values.
Standard Format
The input data may also be in standard (stacked) format. For Example 1 of Latin Squares Design, this format is shown in Figure 7 of that webpage. The data for Latin Squares design without replication must contain four columns in the order: Rows, Columns, Treatments, Data. Once again the row and column values must be 1, 2, …, r and the treatment values must be A, B, C, … until the rth capital Latin letter. There can be no missing values.
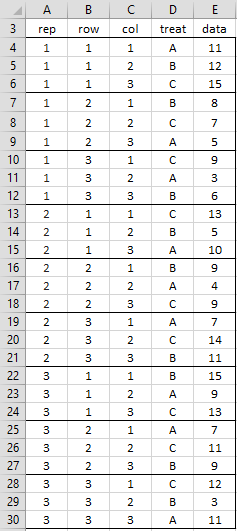
The data for Latin Squares with replication contains five columns with the first column representing the Replication. The values in this column must be 1, 2, …, m where m = the number of replications. For Example 1 Latin Squares Design with Replication, the data could be formatted as in Figure 2.
Figure 2 – Latin Squares with replication in standard format
If data is formatted as in Figure 7 of Latin Squares Design or Figure 2 above, the Standard format with column headings is used in the Latin Squares dialog box. If the first row is omitted then the Standard format without headings would be used.
Examples Workbook
Click here to download the Excel workbook with the examples described on this webpage.
References
Zhu, M. Y. (2005) Latin square and related design. Statistics 514: Design and Analysis of Experiments, Purdue University
http://www.stat.purdue.edu/~yuzhu/stat514s05/Lecnot/latinsquares05.pdf
Penn State (2025) The Latin Square design
https://online.stat.psu.edu/stat503/lesson/4/4.3
Montgomery, D. C. (2013) Design and analysis of experiments, 8th ed. Wiley
https://faculty.ksu.edu.sa/sites/default/files/douglas_c._montgomery-design_and_analysis_of_experiments-wiley_2012_edition_8.pdf


Hello dear Charles, Have you seen any statistical package to randomize and analyze Augmented Latin Square Design???
Have a nice day!!!
Andrés.
Hello Andres,
1. If by augmented latin square design you mean latin squares design with missing data, then see
https://real-statistics.com/design-of-experiments/latin-squares-design/latin-squares-missing-data/
2. I don’t know what you mean by “randomize” in this context.
Charles
Hi!
I tried to conduct Latin Square in Excel, but an error occurs in which says frmLatin. This error commonly occurs when code is incompatible with the version, platform of this application. It also says it can’t find priject or library. It is all under Microsoft Visual Basic for Applications.
Hello Antonija,
If you send me an Excel file with your data and any results, I will try to figure out what is going wrong.
Charles
good day sir I just want to ask what should I do to see this Figure 1 – Latin Squares dialog box
in my Microsoft excel 2013 because I can’t find
You need to install the Real Statistics software. See
https://www.real-statistics.com/free-download/real-statistics-resource-pack/
Charles
how to do the residual plot of Latin Square question using excel?
Badriah,
Real Statistics doesn’t yet provide much information about the residuals of a Latin Squares design. The following is an idea about how to proceed, but admittedly I am not yet providing all the details.
1. The residuals are as described in the formula written below Figure 3 on the following webpage:
https://real-statistics.com/design-of-experiments/latin-squares-design/
2. Calculate the residuals for your actual data
3. You can now create plots based on rows, columns or treatments using Excel’s graphing capabilities.
Charles