Basic Concepts
2^k factorial designs consist of k factors, each of which has two levels. A key use of such designs is to identify which of many variables is most important and should be considered for further analysis.
We restrict our discussion to completely randomized designs with fixed factors. To illustrate the key concepts we will consider the case with 3 factors, which we will label A, B, and C. The levels will be denoted + and – (or +1 and -1). We will suppose that each factor is replicated n times.
Example
Example 1: Create the 2^3 factorial design for the data in Figure 1.
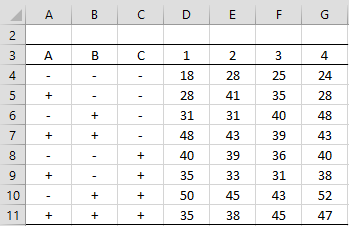
Figure 1 – 23 design with 4 replications
In this example, k = 3 and n = 4. Three factors result in 2^k = 2^3 = 8 rows in the figure. The average effect and SS value for each factor, including interactions, are shown on the left side of Figure 2.
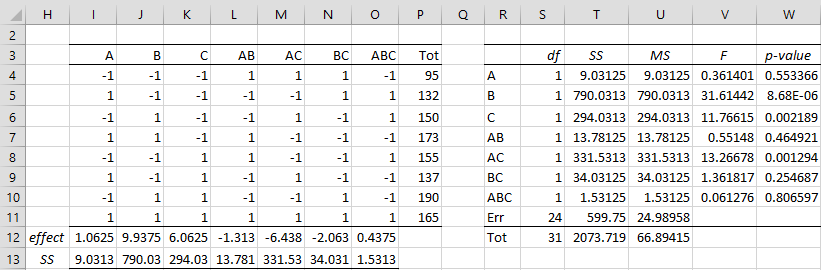
Figure 2 – Average effect sizes and ANOVA
Range I4:K11 is derived from range A4:C11 and range L4:O11 is calculated from I4:K11 in the usual way (e.g. cell O4, corresponding to A*B*C for row 4, is calculated via the formula =I4*J4*K4). The values in column P are the sums of the replication values (e.g. cell P4 contains the formula =SUM(D4:G4)).
Effect Sizes
We now calculate the effect size for A (cell I12) by the formula
=SUMPRODUCT(I4:I11,$P4:$P11)/16
and SSA by the formula
=SUMPRODUCT(I4:I11,$P4:$P11)^2/32
If we highlight range I12:O13 and press Ctrl-R, the effect sizes and SS for the other factors (including interactions) will be filled in as shown.
Note that the denominator in the formula for average effect size is 2^(k-1)*n = 2^2*4 = 16 and the denominator in the formula for SS is 2^k*n = 2^3*4 = 32.
Since we only have two levels, df for each factor = 1 and so MS = SS for each factor. Since dfT = 2^k*n – 1 = 2^3*4 – 1 = 31, it follows that dfErr = dfTot – (2^k-1) = 2^k*(n-1) = 2^3*(4-1) = 24. All the other ANOVA values shown on the right side of Figure 2 are calculated in the usual way, making use of the fact that SSTot = DEVSQ(D4:G11) and SSErr = SSTot – (SSA + SSB + SSC + SSAB + SSAC + SSBC + SSABC).
We see from Figure 2 that factors B, C, and AC are significant. Note that since AB, BC and ABC are not significant, we could include them in the error term. Even though A is not significant, we should keep it in the model since AC is significant.
Note too that if we use Real Statistics’ Three-Factor ANOVA data analysis tool on input range A3:G11 by selecting the Std by Rows option, then we would get the same ANOVA result as shown in Figure 2.
Standard Error
The standard error for each effect size is equal to }")

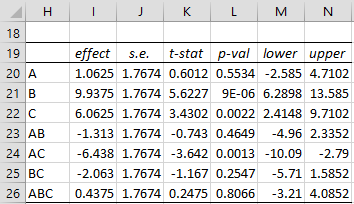
Figure 3 – 95% confidence intervals of effect sizes
Regression Model
We can also establish a regression model (using A, B, C, etc. as the names for the corresponding variables) as follows:
![]()
It turns out that the intercept β0 = AVERAGE(D4:G11) and βA = half of the average effect size for factor A, and similarly for all the other factors. Thus, for our example
![]()
where each variable A, B and C takes the value +1 or -1 (and expressions such as AB should be interpreted as A times B). The standard error for each coefficient is equal to half of the standard error calculated previously, namely 1.7674/2 = 0.8837. The regression analysis is shown in Figure 4.
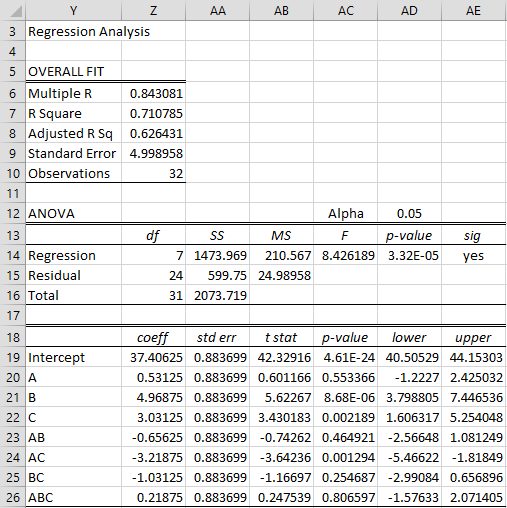
Figure 4 – Regression model
Examples Workbook
Click here to download the Excel workbook with the examples described on this webpage.
References
PennState (2017) The 2k factorial design
https://online.stat.psu.edu/stat503/lesson/6
Montgomery, D. C. (2012) The 2k factorial design. Design and analysis of experiments, 8th ed.
https://faculty.ksu.edu.sa/sites/default/files/douglas_c._montgomery-design_and_analysis_of_experiments-wiley_2012_edition_8.pdf
Dear Dr. Charles,
I’m just starting out in the world of experimental design, and your website has been a great help. However, I don’t understand how you obtain the results for the regression model used in this example. Did you use Real Statistics?
Dear Santiago,
Glad to read that the website has been helpful.
You asked an excellent question.
The regression model in Figure 4 is built using the Real Statistics Regression data analysis tool based on the dats in range I3:P11 of Figure 2.
You can download the Excel file with the details using the link that appears just before the references. You will need to install the free Real Statistics software to use this spreadsheet. You would get the same results using the Regression data analysis tool in Excel’s Toolpak.
Charles
Dr. Charles,
In “Regression Model” part where it can be read “The standard error for each coefficient is equal to half of the standard error calculated previously, namely 1.7807/2 = 0.8904” I think there is an error because the value should be 1.7674 instead of 1.7807. This is confirmed by the values in the “std err” column in Figure 4 which are 0.883699 which is half of 1.7674.
Hello Juan,
Thanks for catching this error. I probably changed the example and forgot to update all the references.
In any case, I have now corrected the error. I appreciate your help in improving the clarity and accuracy of the information on the website.
Charles
Hello again sir it is me, may i ask if what is the Null hypothesis of 2k factorial, is it the same as anova? Sir or no
Hello Rafael,
Yes, the null hypotheses are the same as for ANOVA.
Charles
Hi Charles,
I found a discrepancy between the results of the regression analysis in the workbooks that I downloaded and this page. In the workbook, there is no difference in the values of the coefficients compared to the effect sizes. Can you please explain.
Thanks for all the good work that you do.
Tuba
Tuba,
Sorry for the delayed response.
I don’t know the results in the workbook became so different from those on the website
Later today I will add an updated version of the workbook that should be consistent with what is shown on the website.
Charles
Hi Charles,
I checked the regression analysis in the workbook for the above example and the coefficients there are identical to those of the ANOVA results, whereas on this page you explain “βA = half of the average effect size for factor A. and similarly for all the other factors.” Can you please explain the reason for this discrepancy?
Anyway, thanks for the excellent work you have done on this website.
Tuba
Tuba,
The values on the website should be the correct ones. I will correct the results on the examples workbook later today.
See the following webpage for more details:
https://online.stat.psu.edu/stat503/book/export/html/657
Charles
How to calculate F value and p value in Figure 2?
E.g. for factor A, F = MS_A / MS_Err and p-value = F.DIST.RT(F, df_A, df_Err)
The same is true for the other factors.
Charles
Hi Charles:
In your explanation of Figure 2 calculations, you “Note that the denominator in the formula for average effect size is 2^(k-1)*n = 2^2*4 = 16 and the denominator in the formula for SS is 2^k*n^2 = 2^3*4 = 32.”
For the SS calculation, 2^k*n^2 does not equal 2^3*4 because n=4, not n^2. I’m not sure which is incorrect, squaring the n or the result of n^2?
Thanks for your website, it is very helpful. Good luck for your work in the future.
Hi Harold,
Sorry for the late response. Glad you like the website and find it useful.
The formula should be 2^k*n. I have now corrected this on the webpage.
Thanks for finding this error. I appreciate your help in improving the accuracy of the website.
Charles
is it possible to have a design like split plot in a factorial experiment on rcbd
Henry,
I believe this is possible. See, for example, the following webpage:
https://pdfs.semanticscholar.org/1f9c/dbe0c64014f0cf7aff411e2e87753828519f.pdf
Charles
Apreciado Dr Zaionitz, hay un error sencillo donde dice que calcular el efecto de A en la celda J12; es en la celda I12, donde hará el cálculo no en la J12.
Dear Dr. Zaionitz, there is a simple error where it says that calculate the effect of A in cell J12; is in cell I12, where it will do the calculation not in J12.
Gerardo,
Thanks for catching this mistake. As always, I appreciate your help. I have now corrected the error on the webpage.
Charles
Charles,
Waste of time would be to use a bad resource with poor or wrong explanations. Your website is very well-written and useful, which saves a lot of time for me. Proofreading is one of the few things we can give back to you for putting it all together.
I have another question about 2^k DOE. When we calculate composite effects, we multiply corresponding units of “sub-effects”. For example, for untreated sample at row 1 AB = (-1)*(-1) = 1. Although mathematically correct, logically it doesn’t make sense to me. A and B were both at the lowest level, but AB became the highest level? If it means that negative-negative interaction was tested, then ABC for row 1 is (-1) again? May be you have explanation somewhere on your site already?
Thanks,
Vitali
Vitali,
Yes, you are correct, if A, B and C are all -1, the AB is 1 and ABC is -1. The calculation doesn’t have anything to do with highest or lowest level.
This is explained on the following webpage, although the explanation there may not satisfy you any more than the one on the referenced webpage does.
Interactions
Charles
Hi Charles,
In the regression model: “y = 37.406 + 531A + … ” coefficient for A should be 0.531 instead of 531.
I understand that it’s not a big deal, which can be figured out easily by following text instructions (which are correct). Nonetheless, it stumbled me for a few minutes since I couldn’t understand how you got such a big coefficient on not significant factor.
Thanks for the great resource!
Vitali
Vitali,
Thank you very much for finding this error. I really appreciate your help in improving the quality and reliability of the information on the website. Although the error was a simple typing mistake, it caused you to waste time and so I am grateful that thanks to you, others won’t have the same problem.
Charles