Introduction
For any set of weights W = {w1, w2, …, wn} where each wi ≥ 0 and wi > 0 for at least one i, the weighted mean of a sample S = {x1, x2, …, xn} is defined by
![]()
where
The biased weighted variance of the sample is
When all the weights are the same, this reduces to the usual
which is the maximum likelihood estimate of the variance σ2. It turns out that if the wi are frequency weights, then the biased weighted variance is also the MLE of σW2.
We now seek an unbiased estimate of the weighted variance.
Unbiased weighted variance (frequency weights)
In this case, we consider the to be non-negative integers that indicate the number of replications of the sample . We clearly want the unbiased sample variance to be the same as that of the unweighted sample with replications. This is the situation examined in Frequency Table Statistics. Here, the unbiased estimate of the variance is
The sample size in this case is viewed as w and not n.
Note that if the wi are percentages, then we still need to know the full sample size N. Replacing wi by Nwi will yield the desired result.
Unweighted Case
The unweighted variance is equivalent to the weighted variance where all the weights are equal to 1. In this case, w = n and the weighted mean is equal to the unweighted mean. Thus, the weighted unbiased variance is equivalent to the (unweighted) sample variance.
Unbiased weighted variance (reliability weights)
We can show that
where
Now define the following statistic
This is the unbiased weighted variance when reliability weights are employed.
We can simplify sW2 as follows
Note that if the weights are normalized by replacing wi by wi/w, then
and so
Unweighted Case
If all the weights are the same, the normalized weights are all 1/n. Thus
and so
In this case, the weighted unbiased variance is equivalent to the usual sample variance.
Unbiased weighted standard deviation
The unbiased weighted standard deviation is equal to the square root of the unbiased weighted variance. This is true for both frequency and reliability weights.
Weighted covariance matrix
For an n × k matrix X, each of whose rows Xi = [xij] is assigned a weight wi, the weighted mean vector is
Worksheet Functions
The Real Statistics Resource Pack provides the following worksheet functions.
WVAR(R1, Rw, rel) = the unbiased weighted variance for the data in column array R1 and weights in column array Rw. If rel (default TRUE), then it is assumed that reliability weights are used; otherwise frequency weights are used.
WSTDEV(R1, Rw, rel) = the unbiased weighted standard deviation for the data in column array R1 and weights in column array Rw = SQRT(WVAR(R1, Rw, rel)).
WCOV(R1, Rw, rel) = the unbiased weighted covariance matrix for the data in the n × k array R1 and weights in the n × 1 column array Rw.
Examples
Weighted variance (reliability weights)
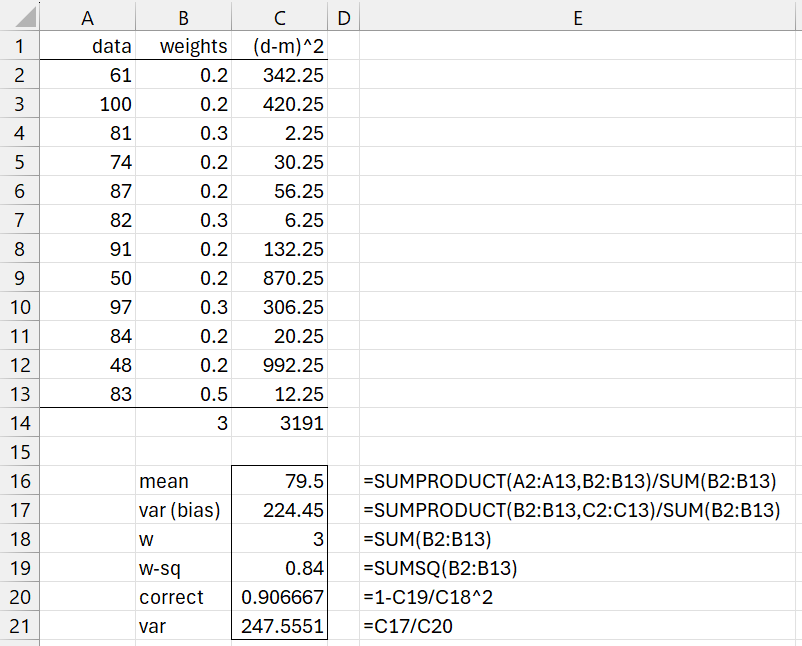
Example 1: Find the weighted variance for the reliability weights in B2:B13 and data in A2:A13.
Figure 1 – Weighted variance (reliability weights)
We see from Figure 1 that the weighted mean is 79.5 (cell C16) and the (unbiased) weighted variance is 247.5551. We obtain the same values by using the formulas =MEAN(A2:A13, B2:B13) and =WVAR(A2:A13, B2:B13), respectively. The unbiassed weighted standard deviation is 15.73389, which can be obtained from the formula =SQRT(C21) or =WSTDEV(A2:A13, B2:B13).
Weighted Variance (frequency weights)
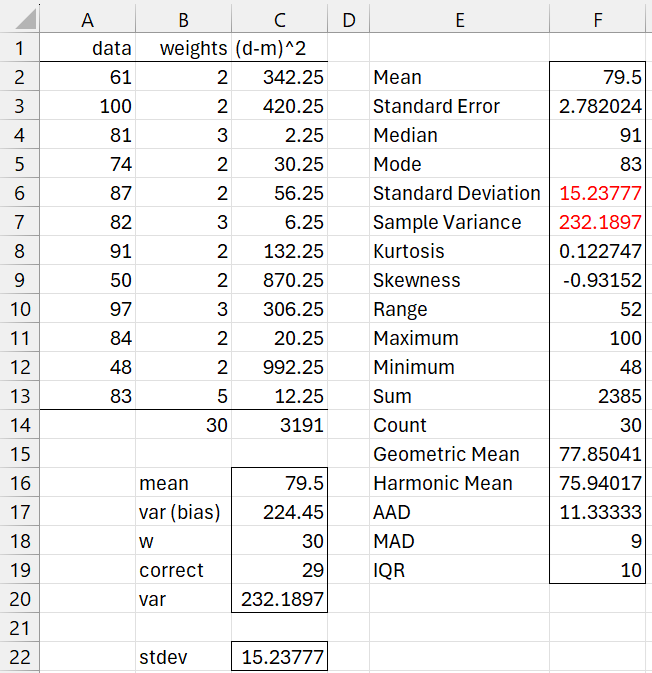
Example 2: Repeat Example 1 using frequency weights for a sample of size 30 where the weights in column B of Figure 1 represent the proportions of the sample.
Since the sum of the weights is 3 and the sample size is 30, we need to multiply the weights in column B by 10 to obtain the frequencies. The weighted variance is now calculated as shown in Figure 2.
Figure 2 – Weighted variance (frequency weights)
The biased weighted variance of 224.45 (cell C17) is calculated as in Figure 1. The unbiased weighted variance (cell C20) is calculated by =C17/(C18-1), the square root of this value is the unbiased weighted standard deviation (cell C22).
The variance and standard deviation can also be calculated, respectively, by the formulas WVAR(A2:A13, B2:B13, FALSE) and =WSTDEV(A2:A13, B2:B13, FALSE).
Finally note that we can obtain the same values using the Frequency Table data analysis tool, whose output is shown in columns E and F. Cells F6 and F7 contain the desired results.
Weighted Covariance Matrix
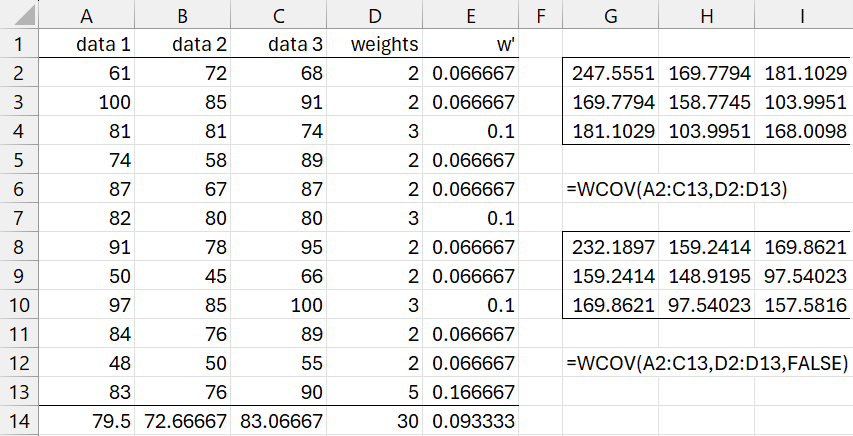
Example 3: Find the weighted covariance matrix for the data in range A2:C13 using the reliability weights in D2:D13.
We first normalize the weights as shown in column E. E.g. cell E2 contains the formula =D2/D$30 where D30 contains the formula =SUM(D2:D13). Next, we calculate the sum of the squared normalized weights, as shown in cell E14 using the formula =SUMSQ(E2:E13).
Figure 3 – Weighted covariance matrix
We next find the weighted means for the three data sets, as shown in range A14:C14. This is done by inserted the formula =SUMPRODUCT(A2:A13,$E2:$E13) in cell A14, highlighting range A14:C14, and pressing Ctrl-R.
Finally, we insert the following array formula in range G2:I4.
=MMULT(TRANSPOSE(A2:C13-A14:C14),E2:E13*(A2:C13-A14:C14))/(1-E14)
This is the weighted covariance matrix. We obtain the same result by using the Real Statistics formula =WCOV(A2:C13, D2:D13) in range G2:I4.
Note that the value in cell G2 is the same as the value of C21 of Figure 1. This is because the data in column A of Figures 1 and 3 are the same, and the normalized weights in both figures are the same.
To get the frequency version of the weighted covariance matrix, we use the following formula:
=D14*MMULT(TRANSPOSE(A2:C13-A14:C14),E2:E13*(A2:C13-A14:C14))/(D14-1)
Examples Workbook
Click here to download the Excel workbook with the examples described on this webpage.
References
Wikipedia (2024) Weighted arithmetic mean
https://en.wikipedia.org/wiki/Weighted_arithmetic_mean#Weighted_sample_variance
Cross Validated (2013) Bias correction in weighted variance
https://stats.stackexchange.com/questions/47325/bias-correction-in-weighted-variance


