Weighted Mean
Definition 1: For any set of weights W = {w1, w2, …, wn} where each wi ≥ 0 and wi > 0 for at least one i. the weighted mean (also called the weighted average) of the data set S = {x1, x2, …, xn} is defined by

where w = the sum of the wi. When wi =1 for all i, the weighted mean is the same as the mean. In fact, this is also true when all the weights are the same.
Worksheet Functions
Excel Function: The weighted mean is calculated in Excel using the worksheet formula
=SUMPRODUCT(R1,R2)/SUM(R2)
where R1 contains the elements in S and R2 contains the elements in W. We typically think of the weights as having to add up to one although this is not necessary since dividing by the sum of the weights is equivalent to having the weights add up to one. When the weights do add up to one, the formula for the weighted mean is simply the sum, namely =SUM(R1) in Excel.
Real Statistics Function: The weighted mean can also be calculated using the function MEAN(R1, R2) where R1 contains the elements in S and R2 contains the elements in W. If R2 is omitted then the ordinary mean is returned (as described in Measures of Central Tendency).
Example
Example 1: Find the weighted mean for the data in column E of Figure 1 based on the weights in column F.
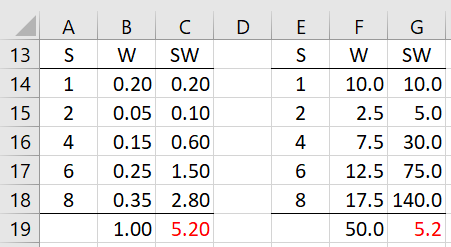
Figure 1 – Weighted mean
We calculate the weighted mean by multiplying each data element by its corresponding weight (as shown in column G) and then summing these values up to obtain the value of 260. We next divide 260 by the sum of the weights (namely 50 as shown in cell F19) to obtain the weighted mean of 5.2 (as shown in cell G19).
This approach is equivalent to dividing each of the weights by 50 to obtain weights that do sum to one (as shown in column B) and then summing the product of the weights and data values (shown in column C) to obtain the value 5.2 shown in cell C19.
We obtain the same result using any of the following formulas:
=SUMPRODUCT(E14:E18,F14:F18)/SUM(F14:F18)
=SUMPRODUCT(A14:A18,B14:B18)
=MEAN(E14:E18,F14:F18)
=MEAN(A14:A18,B14:B18)
Weighted Median
Definition 2: Assuming that the elements in S are in ascending sorted order, the weighted median is defined to be xj where
If, however
![]()
for some j, then the weighted median is instead defined to be (xj + xj+1)/2. If all the weights are equal, the weighted median is simply the ordinary median.
Worksheet Function
Real Statistics Function: The weighted median can also be calculated using the function MED(R1, R2) where R1 contains the elements in S and R2 contains the elements in W. If R2 is omitted then the ordinary median is returned, i.e. MEDIAN(R1) (as described in Measures of Central Tendency).
Example
Example 2: Find the weighted median for the data in column A of Figure 2 based on the weights in column B.
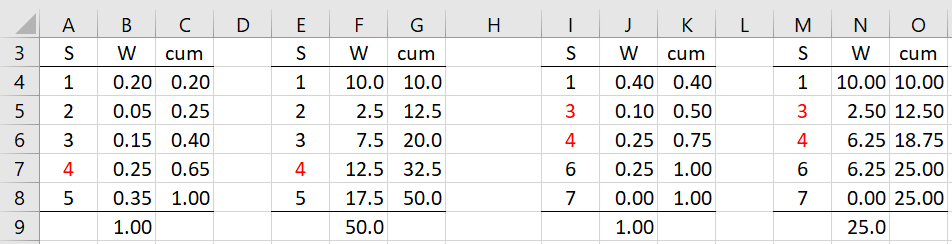
Figure 2 – Weighted median
To obtain the result, we first sort the data in ascending order and then create a cumulative sum of the weights as shown in column C. This is done by inserting the formula =B4 in cell C4 and the formula =C4+B5 in cell C5 and then highlighting range C5:C8 and pressing Ctrl-D. Since cell C7 is the first cell in column C whose value is larger than .50, the corresponding value in cell A, namely 4 in cell A7, is the weighted median. We obtain the same result using the Real Statistics formula =MED(A4:A8,B4:B8).
Weights that don’t sum to one
When the weights don’t sum to 1, as shown in the second example in the figure, the approach is the same except that we need to find the first entry in the cumulative weights column that is larger than 50% of the sum of the weights. For the second example (in columns E, F, G), the sum of the weights is 50 as shown in cell F9, and so half of this value is 25. The first entry in column G that is larger than 25 occurs in cell G7 (32.5 > 25), and so the corresponding data value, namely 4 (in cell E7) is the weighted median.
When the cumulative sum of the weights reaches a value that is exactly half of the sum of the weights, then we essentially have two medians and so we take the average of these two values. This is shown in the third and fourth examples. For the third example, this occurs in cell K5 (with value .50), while for the fourth example, this occurs in cell O6 (with value 12.5 which is exactly half of the sum of the weights shown in cell N9). Thus, the median is the average of the data value in this row and the following row, i.e. the average of 3 and 4, namely 3.5.
Weighted Percentile
Weighted percentiles whose percentile value is p (0 ≤ p ≤ 1) are computed in a similar manner to the weighted median. In fact, the weighted median is a special case of the weighted percentile with p = .5.
For example, for the data in columns I and J of Figure 2, the weighted percentile for any p < .40 is 1 (the minimum). The weighted percentile for p = .40 is 2, i.e. the mean of 1 and 3. The weighted percentile for p = .45 is 3 and the weighted percentile for p = 1.00 is 7 (the maximum).
Worksheet Function
The weighted median function, MED(R1, R2, p), actually takes a third argument p (default .5) which returns the weighted percentile for p. When p is omitted the weighted median is returned.
E.g. Referring to Figure 2, the formula =MED(I4:I8,J4:J8,.45) returns the value 3.
Examples Workbook
Click here to download the Excel workbook with the examples described on this webpage.
Reference
Wikipedia (2020) Weighted median
https://en.wikipedia.org/wiki/Weighted_median
Is this same functionality possible with a “weighted” standard deviation?
Something like this: =stdev.w(A2:A20,B2:B20)
Where column A is the data and Column B is the replicate weight multiplier.
If not, this would be a really convenient feature that complements the MEAN() and MED() functions nicely.
Good point,
There are at least two ways of computing the weighted standard deviation. The repeated method is already provided as part of the descriptive statistics option of the Frequency Table data analysis tool. The other approach is not supported.
I will add a weighted standard deviation worksheet function in the next release of the Real Statistics software.
Charles
I’m pretty sure I found a bug in the weighted mean and median.
If there are gaps in either column, but not both, the data isn’t calculated correctly.
I believe that in practice, the function should only be calculating where there are complete entries in BOTH columns, otherwise, it skews your calculation.
Real example from a research paper I’m working on:
Result Set Removed Gaps Gaps Left in
———————————————————-
Median: $50,000 $50,200
Mean: $51,154 $49,023
Yes, both columns need to be complete.
Charles
This is how you calculate weighted standard deviation. But before you get that, you need weighted mean first.
Say if you have a data set like below:
You teach two classes. Your principal asked how’s your student performing overall?
Class I has 100 students and average marks is 50%
Class II has 200 students and average marks is 60%
So, your weighted mean is = (Sum of values x wights) / Sum of weights
= [(50 x 100) + (60 x 200)]/ (100+200)
=17000/300
=56.67%
So, on average your students go 56.7%
Now let’s calculated Weighted SD
Weighted SD = Square root of (A/B)
Where A = Sum of [weight x (value – weighted mean)whole-square]
And B = C/D
Where C = (number of non-zero weights – 1) x Sum of weights
And D = number of non-Zero weights
Here A = 100 x (50 – 56.7)^2 + 200 x (60 – 56.7)^2 = 6667
C = (2 – 1) x (100+200) = 300
D = 2
So, B = C/D = 150
So, Weighted SD = Square root of (6667/150) = 6.7
So, your students got the number weighted mean ± weighted SD = 56.7±6.7
Here weighted mean is average number, and weighted SD is heterogeneity in number.
Thanks for reading!
Hello,
I will comment on the weighted mean.
What you calculated was the mean. You used the number of students as a “weight”, but this is not the type of weight that is referred to on this webpage. In fact, if you check the calculation on all 300 subjects individually you will see that the usual mean/average is 56 2/3.
To calculate the weighted mean you need to provide some weights. E.g. say the scores in class I count three times those in class II. In this case, the weight for class 1 is .75 and the weight for class II is .25.
Charles
Just like the weighted median, the weighted percentile would be very useful. And modifying the MED function would be simple.
Thank you very much
Ricardo
Hello Ricardo,
Thanks for your suggestion. I will look into adding this capability.
Charles
Thank you very much for this useful package! I was wondering if you could help me with a conditional MED. My intution tells me the formula should be something like this: =MED(IF(B2:B22=”A”,C2:C22),IF(B2:B22=”A”,D2:D22)), where C has the variable of interest, D has the weights, and B has the condition. I essentially want to work out the weighted mean for only those rows in which column B = “A”. It isn’t working though. Any assistance will be greatly appreciated.
Hello Fouche,
I just made a small change in the MED function that allows your formula to work. I expect to issue a new release of the Real Statistics software (Rel 8.7) next week which will include this change.
Charles
That is awesome!! Wow! Thanks Charles!
Thank you so much for this wonderful package. I was wondering whether you can help me with a conditional mean. My intuition gives me this formula: =MED(IF(B2:B22=”A”,C2:C22),IF(B2:B22=”A”,D2:D22)) where column B is the condition, C is the value of a wage for e.g. and D has the weights. Essentially I want the median for only rows with A in column B.
Thanks for the reply.Do you have some share information on how to do the exponential median calculation? In pandas we can do mean, standard deviation and sum but not median.
By “exponential median” do you mean the median of the exponential distribution?
Charles
Hello thanks for sharing this wonderful info. I was also looking for doing Weighted Sum. Can you share some link to how to do the weighted sum calculation.
Hello,
The calculation for a weighted sum is the same as for a weighted mean except that you don’t divide by w.
In Excel, this is achieved via the formula =SUMPRODUCT(R1, R2).
Charles