Basic Concepts
The MAD (or IQR) approaches for identifying outliers, as described in Identifying Outliers using MAD, are reasonable for symmetric data, but for skewed data, a double MAD approach is preferred. In this case, data elements outside the interval (Median – c ⋅ LMAD, Median + c ⋅ UMAD) are potential outliers where x-tilde = Median {x1, …, xn} and
Worksheet Function
Real Statistics Function: The Real Statistics Resource Pack supplies the following worksheet function.
DoubleMAD(R1, lower, harrell) = the lower MAD when lower = TRUE and the upper MAD when lower = FALSE. If harrell = TRUE then the Harrell-Davis median is used; otherwise (default) the ordinary median is used.
See Harrel-Davis Quantiles for a description of the Harrell-Davis median.
Example
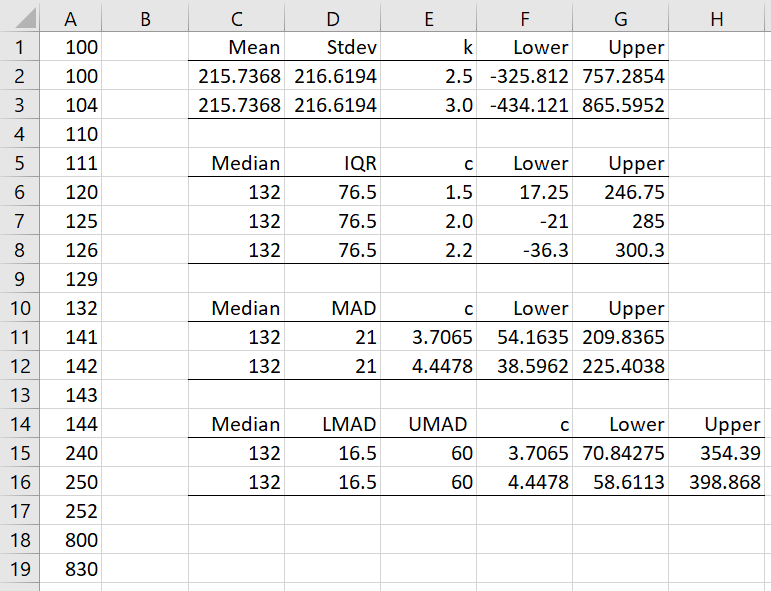
Example 1: Determine the outliers for the data in column A of Figure 1.
Figure 1 – Double MAD
E.g. cell D15 and E15 contain the formulas =Double(A1:A19,TRUE) and =DoubleMAD(A1:A19,FALSE). Using the MAD approach, we see that 250, 252, 800, 830 are potential outliers, but since the data is skewed, it is better to use the Double MAD approach. Based on Double MAD, only 800 and 830 are potential outliers.
Examples Workbook
Click here to download the Excel workbook with the examples described on this webpage.
Reference
Akinshin, A. (2020) DoubleMAD outlier detector based on the Harrell-Davis quantile estimator
https://aakinshin.net/posts/harrell-davis-double-mad-outlier-detector/#Rosenmai2013
