As described in Frequency Tables, you can’t simply use the Excel functions AVERAGE and VAR.S to calculate the mean and variance for data in the form of a frequency table. One approach to addressing this issue is to use a function that converts data in the form of a frequency table to raw data, from which you can calculate not only the mean and variance but also any of the other descriptive statistics that are supported.
Conversion Functions
Real Statistics Functions: The Real Statistics Resource Pack furnishes the following array function.
FREQ2RAW(R1, R2): outputs a column array with the raw data corresponding to the data in the frequency table described by R1 and R2, where R1 contains the data elements in the frequency table and R2 contains the corresponding frequencies.
FREQ2RAW(R1): equivalent to FREQ2RAW(R2,R3) where R2 is the first column of R1 and R3 is the second column of R1.
RAW2FREQ(R1): takes a column array R1 with labels and outputs an equivalent two-column frequency table consisting of a column of unique labels and a column of corresponding frequencies.
Example
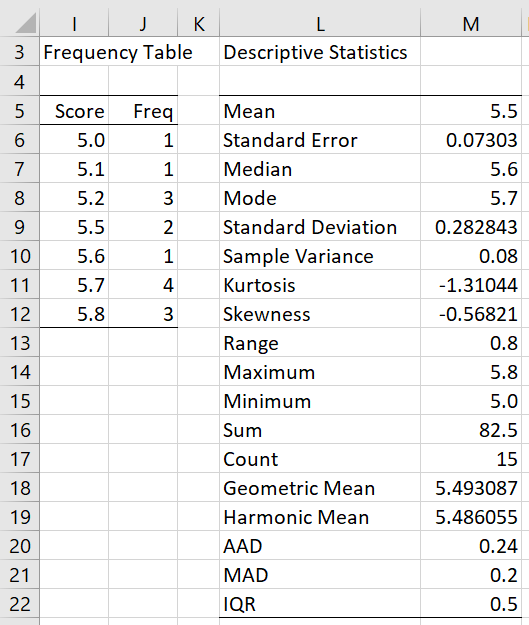
Example 1: Find the descriptive statistics described in Figure 5 of Descriptive Statistics Tools for the data in the frequency table in range I6:J12 of Figure 1.
We can provide these statistics using the FREQ2RAW function. E.g., the mean (cell M5 of Figure 1) can be calculated by the array formula =AVERAGE(FREQ2RAW(I6:I12, J6:J12)) or the equivalent array formula =AVERAGE(FREQ2RAW(I6:J12)).
Figure 1 – Descriptive statistics for a frequency table
Actually, many of the entries in Figure 1 can be calculated directly in Excel without resorting to the FREQ2RAW function.
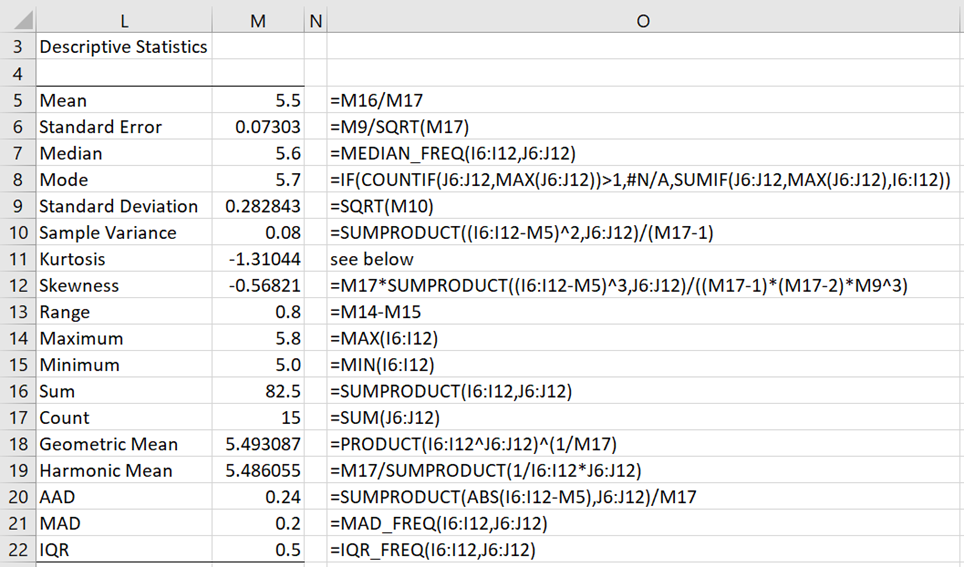
Column O of Figure 2 shows how to do this for all the statistics from Figure 1 except for Median, MAD, and IQR.
Figure 2 – Formulas for descriptive statistics
The formula for kurtosis in cell M11 is
=M17*(M17+1)*SUMPRODUCT((I6:I12-M5)^4,J6:J12)/((M17-1)*(M17-2)*(M17-3)*M10^2)-3*(M17-1)^2/((M17-2)*(M17-3))
To calculate the Median, MAD, and IQR, we can use the following Real Statistics functions.
Worksheet Functions
Real Statistics Functions: The Real Statistics Resource Pack furnishes the following functions. Here, the frequency table is described by R1 and R2. R1 is a column array that contains the data elements in the frequency table. R2 is a column array that contains the corresponding frequencies. Alternatively, R2 can be omitted, in which case R1 is a two-column array, whose first column contains the data elements and whose second column contains the frequencies.
MEDIAN_FREQ(R1, R2) = median of the data in the frequency table
MAD_FREQ(R1, R2) = median absolute deviation (MAD) of the data in the frequency table
SMALL_FREQ(R1, R2, k) = the kth smallest element of the data in the frequency table
PERCENTILE_FREQ(R1, R2, p, bexc) = the pth percentile of the data in the frequency table
QUARTILE_FREQ(R1, R2, q, bexc) = the qth quartile of the data in the frequency table where q = 1, 2, 3 or 4
IQR_FREQ(R1, R2, bexc) = inter-quartile range (IQR) of the data in the frequency table
If bexc = TRUE, then the exclusive version of percentiles is used; otherwise (default) the inclusive version is used.
Note that these functions require that data elements in R1 are in sorted order.
Note that the mean for the frequency table in cell M5 is the weighted mean of the score values shown in column I with the frequency values shown in column J used as weights, and so can be calculated by =SUMPRODUCT(I6:I12,J6:J12)/SUM(J6:J12) or the Real Statistics formula=MEAN(I6:I12,J6:J12).
Similarly, the median for the frequency table is the weighted median of the score values with the frequency values. Thus, it can be calculated by the Real Statistics formula =MED(I6:I12,J6:J12).
The median absolute deviation in cell M21 can also be calculated by the Real Statistics array formula =MED(ABS(I6:I12-MED(I6:I12,J6:J12)),J6:J12).
Data Analysis Tool
Real Statistical Data Analysis Tool: The Frequency Table Descriptive Statistics data analysis tool provided by the Real Statistics Resource Pack can be used to convert a frequency table into raw data and to give descriptive statistics for the frequency table.
Example 2: Use the Frequency Table Descriptive Statistics data analysis tool to display the descriptive statistics for the frequency table in the range Q6:R12 of Figure 1 and to convert the frequency table to raw data.
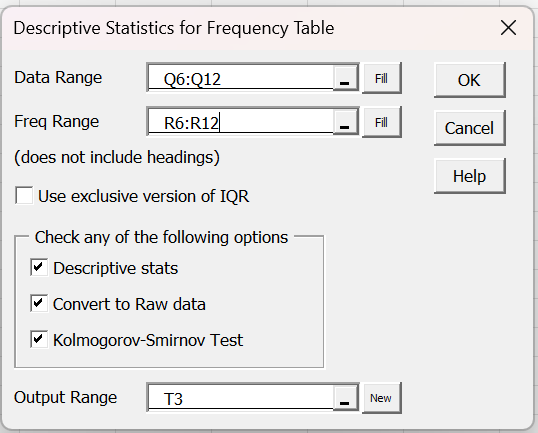
Press Ctrl-m and choose the Frequency Table Descriptive Statistics option. A dialog box will appear as shown in Figure 2.
Figure 3 – Frequency Table dialog box
Fill in the dialog box as indicated and click on the OK button. Note that since the data and frequency elements of the frequency table are adjacent, you can simply enter the combined range, Q6:R12 for Example 1, in the Data Range and leave the Freq Range blank.
The output appears as shown in Figure 4.
Figure 4 – Output from Frequency Table data analysis tool
Note that if Use exclusive version of IQR is checked then bexc = TRUE is used in the IQR_FREQ formula; otherwise, bexc = FALSE is used.
KS Test
The Kolmogorov-Smirnov Test for normality option is explained in KS Test for Normality. For this test to produce valid results the data in the first column of the Data Range must be in ascending sorted order.
Examples Workbook
Click here to download the Excel workbook with the examples described on this webpage.
References
Third Space Learning (2023) Statistics
https://thirdspacelearning.com/gcse-maths/statistics/
Cuemath (2023) Mean absolute deviation formula
https://www.cuemath.com/mean-absolute-deviation-formula/


Charles,
Is there a way to use two NON-adjacent columns for the input to the “Frequency Table Descriptive Statistics option”?
Thanks for examples!
John
Hi John,
The current version requires that the columns be adjacent.
I will add a non-adjacent option in the next software release.
Charles
SUPER. I know that this is not too trivial to implement but adds huge versatility.
Standing by,
John
Just a heads up that the Median_Freq formula has some bugs.
If an empty array (i.e. R2={0;0;0;…etc}) is inputted, then the formula outputs 0.5 when it really should be undefined.
Also, when calculating the median for even element arrays it does not take the average of the two middle values. Instead it adds 0.5 to the lower of the 2 middle values. Such that if the two middle values are more than 1 apart the median is underestimated.
e.g. MEDIAN_FREQ({0;1;2;3;4},{0,3;0;0;3})=1.5 when the median of {1,1,1,4,4,4}=(4+1)/2=2.5 not 1.5.
I got around this by using QUARTILE_FREQ({0;1;2;3;4},{0,3;0;0;3},2)=2.5
Please fix this!!
Hi Josh,
Thanks for catching this error.
I believe that the worksheet function works if 0 is not allowed as a frequency count. In any case, I have now modified the function so that it gives the correct answer in the two cases that you have identified. The new version should appear in the next release of the software, which should be available this month, although I may issue a bug fix release in the next few days to take care of this.
Thanks again. I appreciate your help.
Charles
Hi
How about X with the probability(not the frequency)?
With X and Probability of X ,It seems that we cannot use that function?
Hi Cai,
This tool works only when the frequencies (and not the probabilities) are available. Of course, if you know the probabilities and the total sample size, then you can substitute the probabilities by frequencies. E.g. if the probability is .3 and the total sample size os 1,000, then the frequency will be .3 x 1,000 = 300.
Charles