Basic Concepts
(Credit Scoring) Divergence Statistic: Given two finite distributions p and q with corresponding elements x1, …, xn and y1, …, yn, we define the divergence measure as
This metric is used for credit scoring and is essentially the square of the effect size for the two-sample t-test where the two variances are weighted equally.
Example
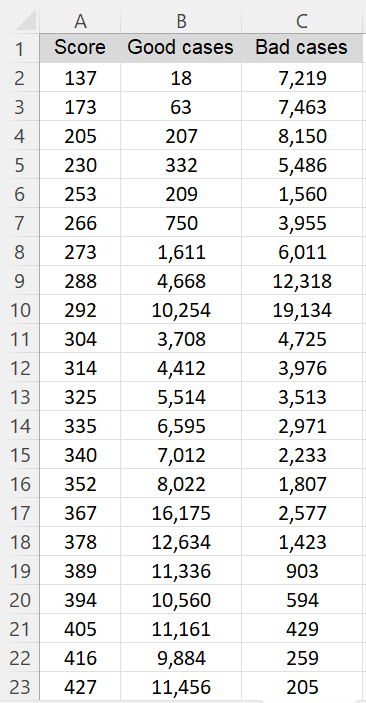
Example 1: Calculate the divergence statistic for the data in Figure 1. Here we view column A as containing data and columns B and C as containing the corresponding frequencies for the two samples.
Figure 1 – Credit scoring data
The calculation of the divergence is shown in Figure B. Column I shows the formulas used in column G.
Figure 2 – Divergence measure
Worksheet Function
Real Statistics Function: The Real Statistics Resource Pack provides the CS_DIVERGE worksheet function that calculates the divergence measurement for credit scoring. This function takes any of the following formats:
CS_DIVERGE(R1): an array R1 that contains three columns: the first column contains data values and the second and third columns contain frequencies (non-negative integers) for the two samples
CS_DIVERGE(R1): an array R1 that contains two columns consisting of the data for two samples
CS_DIVERGE(R1, R2): column arrays R1 and R2 that contain the data for two samples
CS_DIVERGE(R1, R2, R3): column arrays R1, R2, and R3: R1 contains data values and R2 and R3 contain frequencies for the two samples
Examples Workbook
Click here to download the Excel workbook with the examples described on this webpage.
References
Open Risk (2022) Divergence statistic
https://www.openriskmanual.org/wiki/Divergence_Statistic
Zeng, G. (2013) Metric divergence measures and information value in credit scoring
https://www.hindawi.com/journals/jmath/2013/848271/


