We now consider the case where the two sample pairs are not drawn independently, but there is no overlap between the sample pairs. This could happen for many reasons: e.g. the two variables are correlated at one moment in time and again at another moment in time.
Click here for the case where the sample pairs overlap.
Click here for the case where the sample pairs are independent.
Example
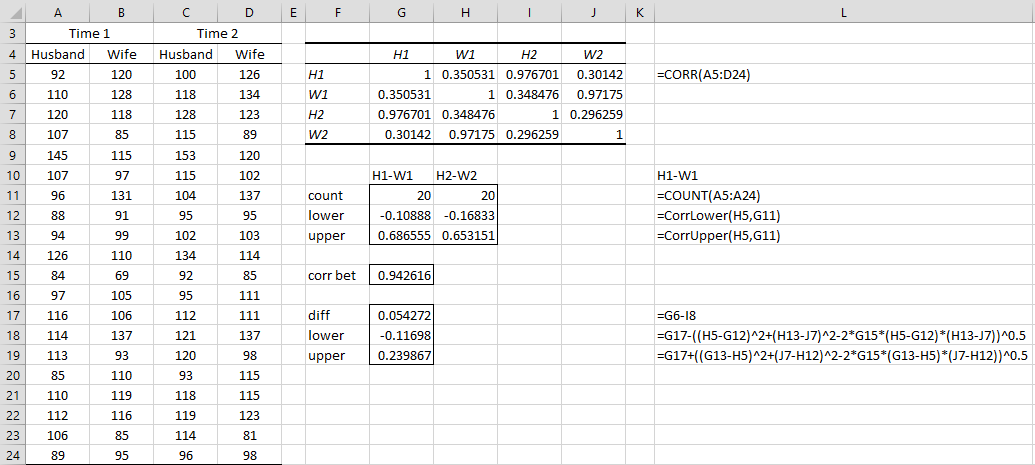
Example 1: 20 couples are given a compatibility test and then receive some counselling after which they are tested again. The scores are shown in Figure 1. Determine whether there is a significant difference between the correlations before and after the counselling.
Figure 1 – Fisher analysis for non-overlapping samples
Note that the formula in cell G15 is
=(0.5*H5*J7*(I5^2+J5^2+I6^2+J6^2)+I5*J6+J5*I6-(H5*I5*J5+H5*I6*J6+I5*I6*J7+J5*J6*J7))/((1-H5^2)*(1-J7^2))
As we can see from the figure, the difference between the couples’ correlation before and after is .054272, with a 95% confidence interval of (-0.11698, 0.239867), which indicates there is no significant difference between the correlation before counselling and the correlation after counselling.
Worksheet Functions
Real Statistics Functions: The following array functions are provided in the Real Statistics Resource Pack to implement the Fisher test described above.
Correl2NonOverlapTest(R1, n1, n2, alpha, lab): array function which outputs the difference between the correlation coefficient of samples 1 and 2 with the correlation coefficient of samples 3 and 4, along with the lower and upper bound of the 1 –alpha confidence interval; where R1 is the correlation matrix for a matrix with 4 columns containing the data for four samples. n1 = size of sample 1 (and 2) and n2 = size of sample 3 (and 4).
If lab = TRUE then the output takes the form of a 3 × 2 range with the first column consisting of labels, while if lab = FALSE (default) then the output takes the form of a 3 × 1 range without labels; If alpha is omitted it defaults to .05.
Corr2NonOverlapTest(R1, alpha, lab) = Correl2OverlapTest(R2, n1, n2, alpha, lab) where R1 is an array with four columns representing four samples and R2 = CORR(R1), n1 = the number of elements in sample 1 (or 2) and n2 = the number of elements in sample 3 (or 4).
For Example 1, the output from the array function
=Correl2NonOverlapTest(G5:J8,G11,H11,,TRUE)
is as shown in range G17:G19 of Figure 1. The same output is produced by the array function =Corr2NonOverlapTest(A5:D24,,TRUE).
Examples Workbook
Click here to download the Excel workbook with the examples described on this webpage.
References
Howell, D. C. (2010) Statistical methods for psychology (7th ed.). Wadsworth, Cengage Learning.
https://labs.la.utexas.edu/gilden/files/2016/05/Statistics-Text.pdf
Diedenhofen, B., Musch, J. (2015) cocor: A comprehensive solution for the statistical comparison of correlations
https://journals.plos.org/plosone/article/file?id=10.1371/journal.pone.0121945&type=printable
Weaver, B., Wuensch, K. (2013) SPSS and SAS programs for comparing Pearson correlations and OLS regression coefficients
https://scispace.com/pdf/spss-and-sas-programs-for-comparing-pearson-correlations-and-l2lon8c5h2.pdf
Rousselet, G. A. (2017) How to compare dependent correlations
https://garstats.wordpress.com/2017/03/01/comp2dcorr/
